

NYC Pulse
Uber Rides Visualization | Manhattan

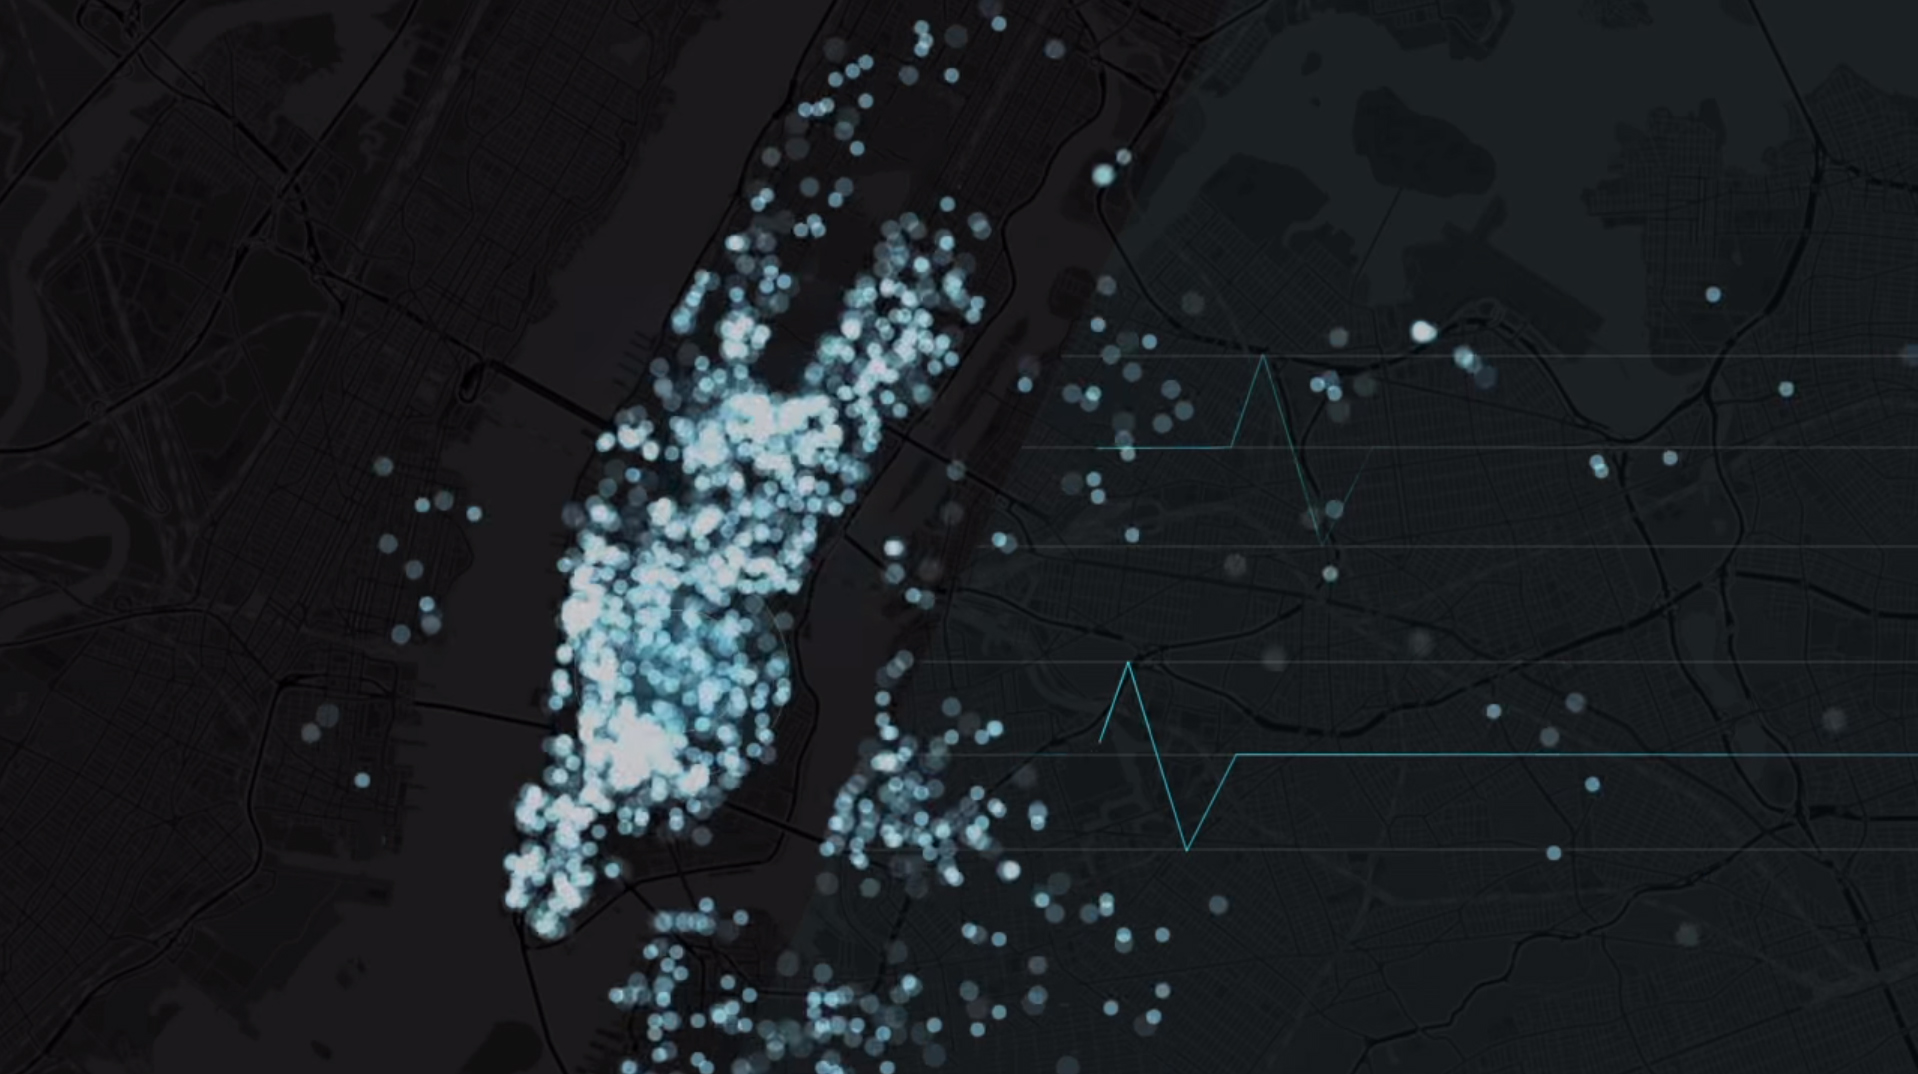
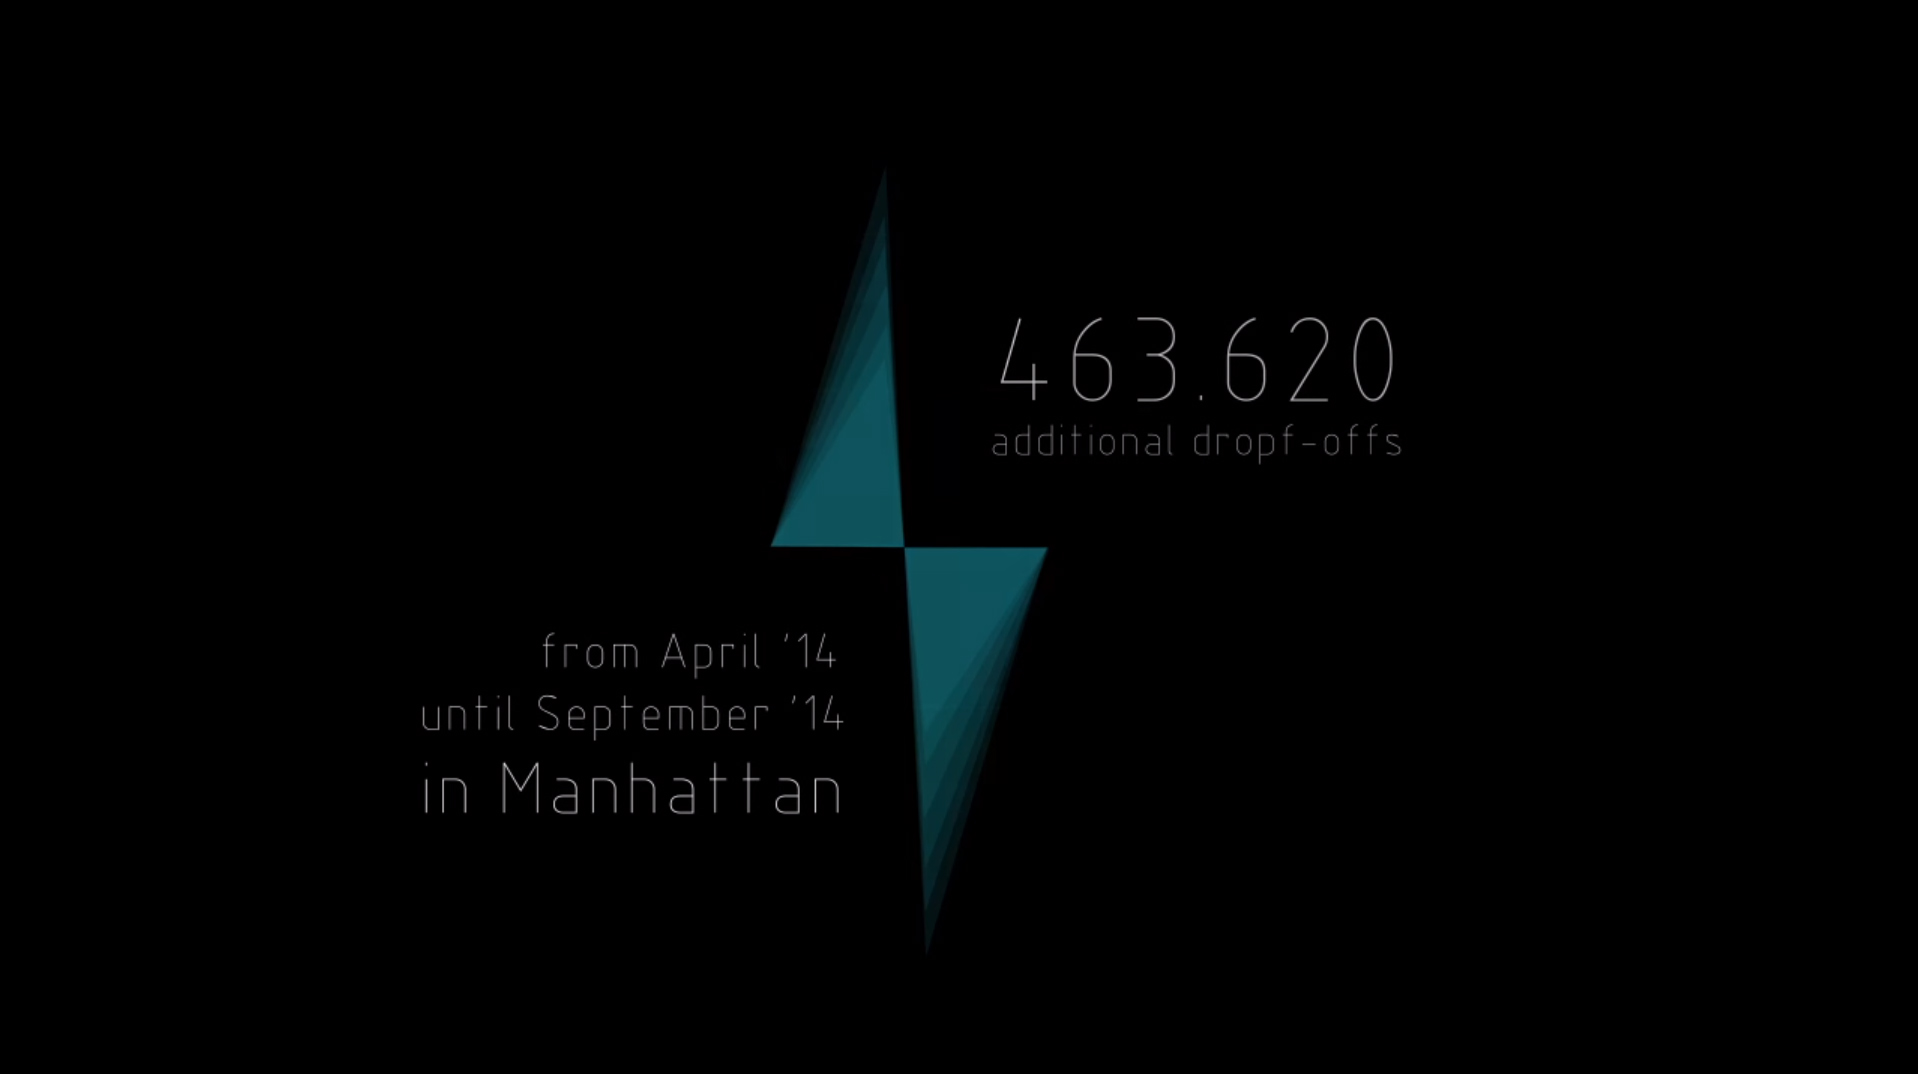
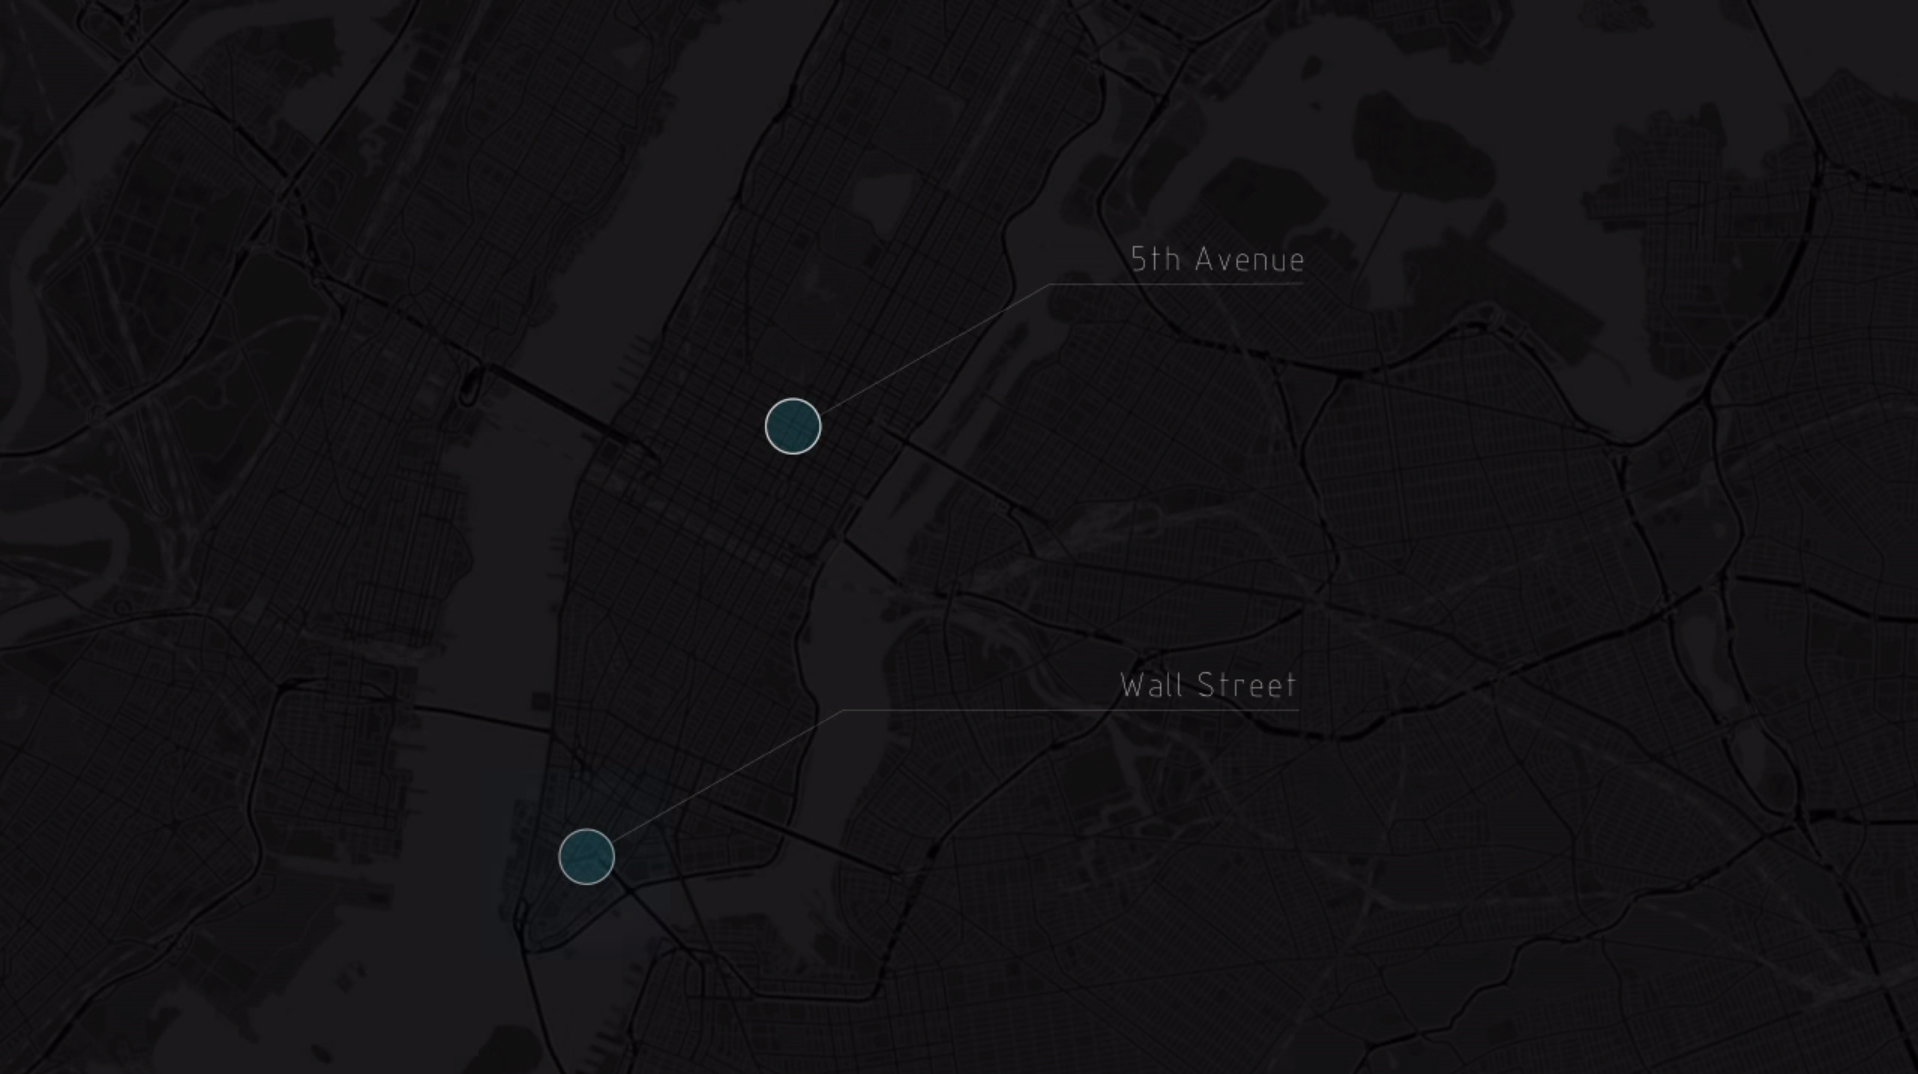
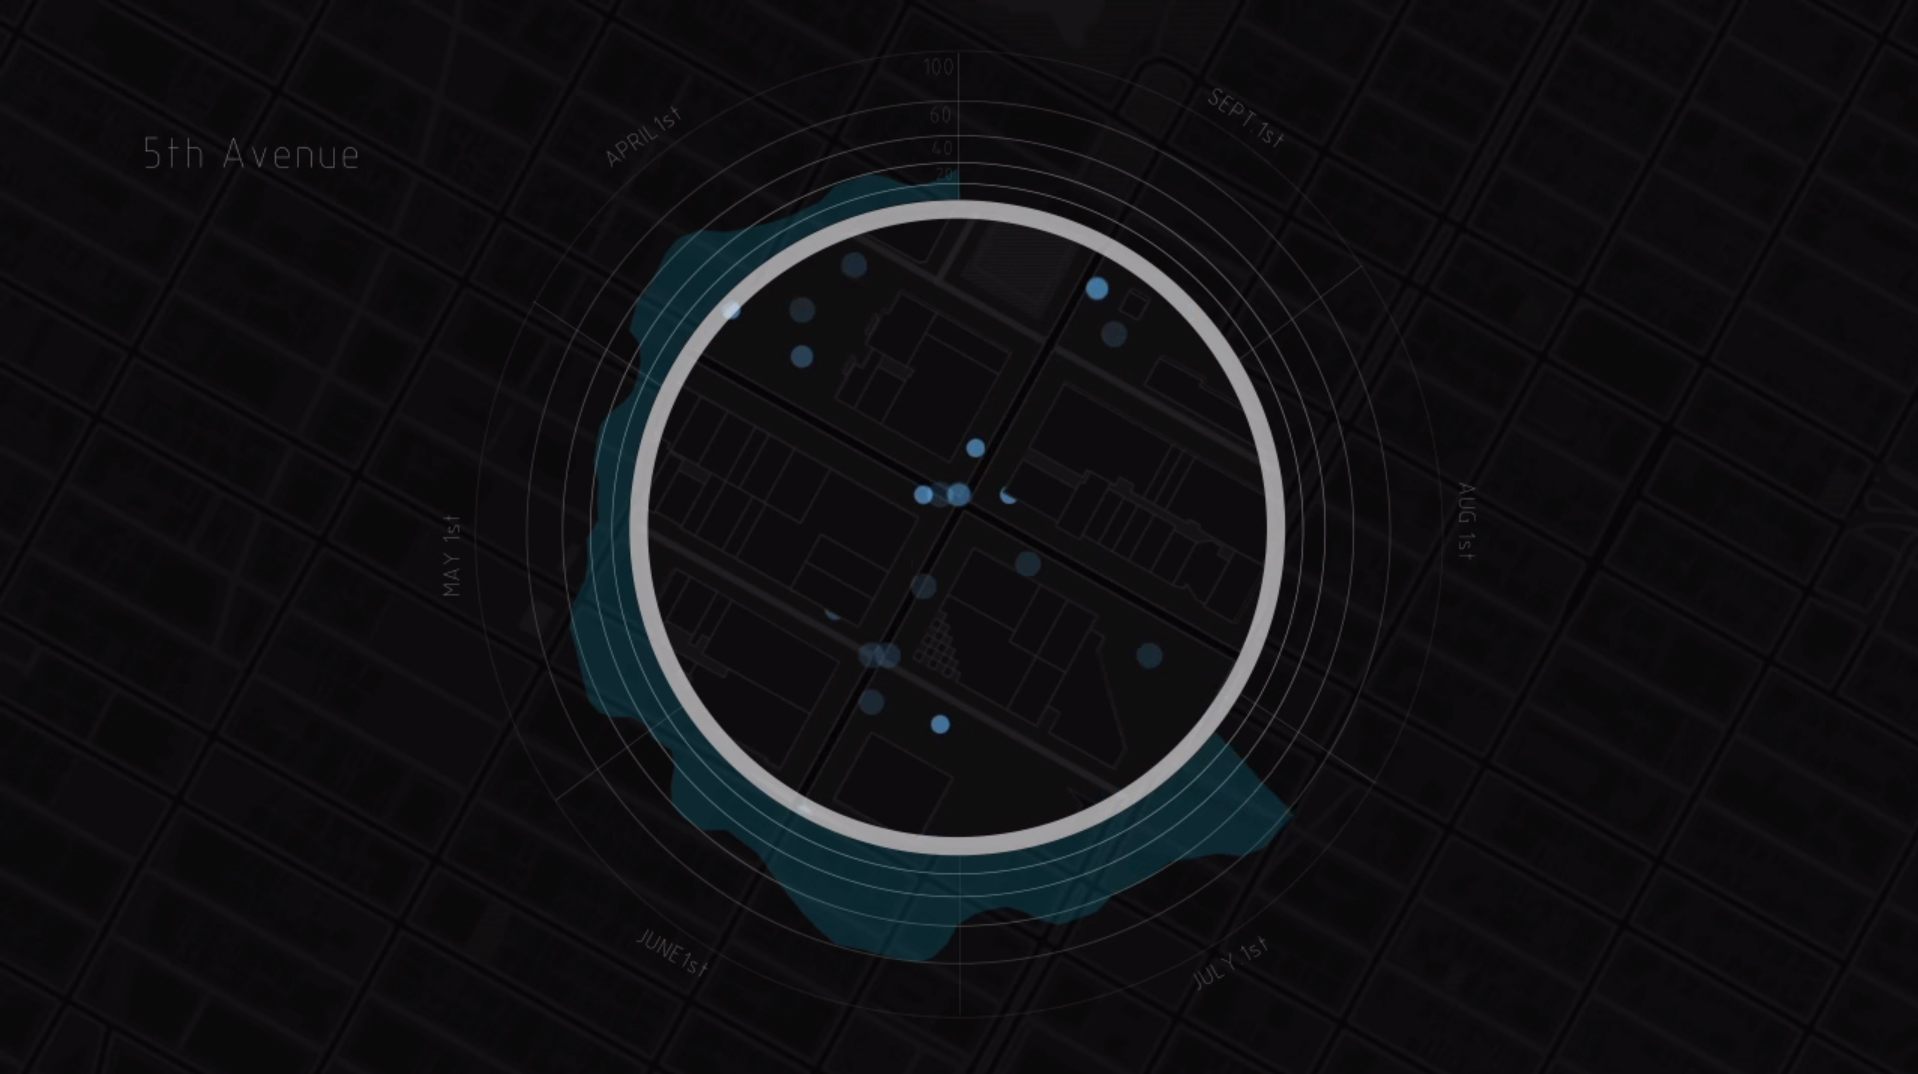
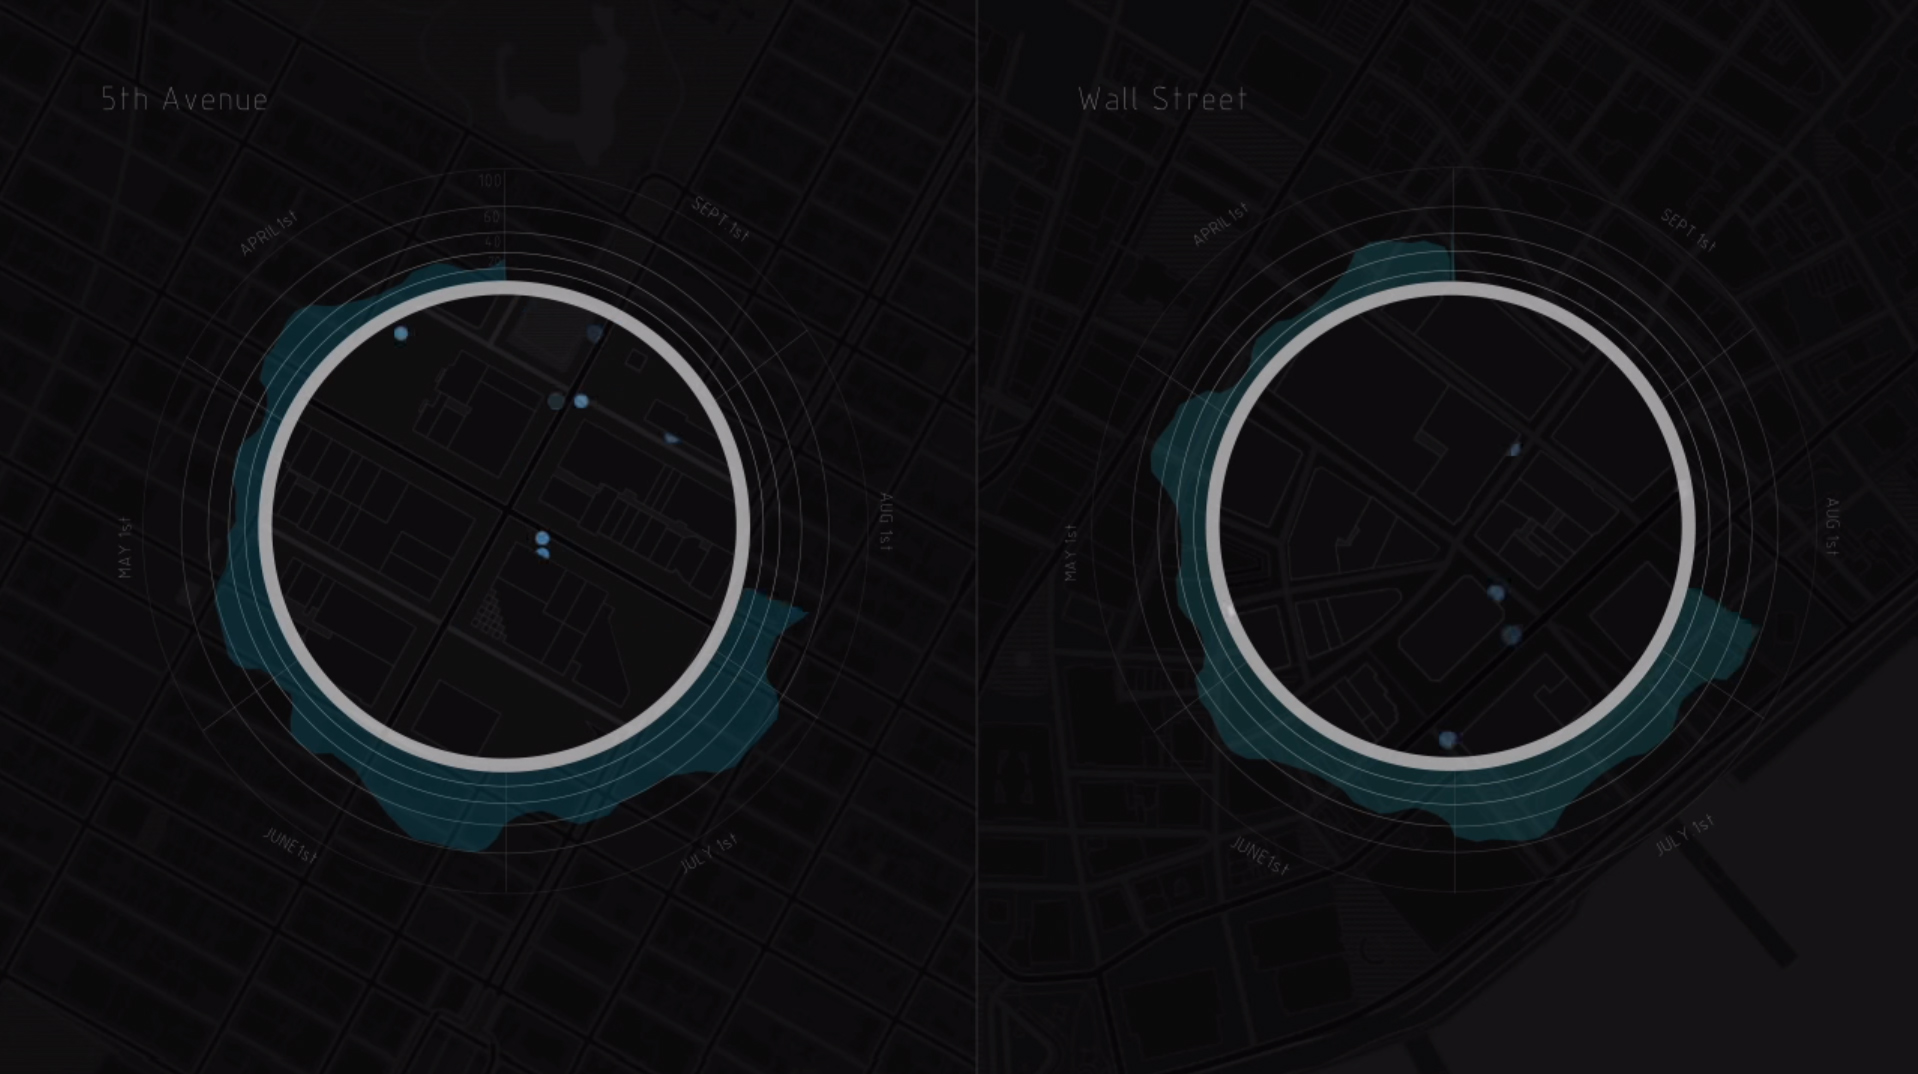
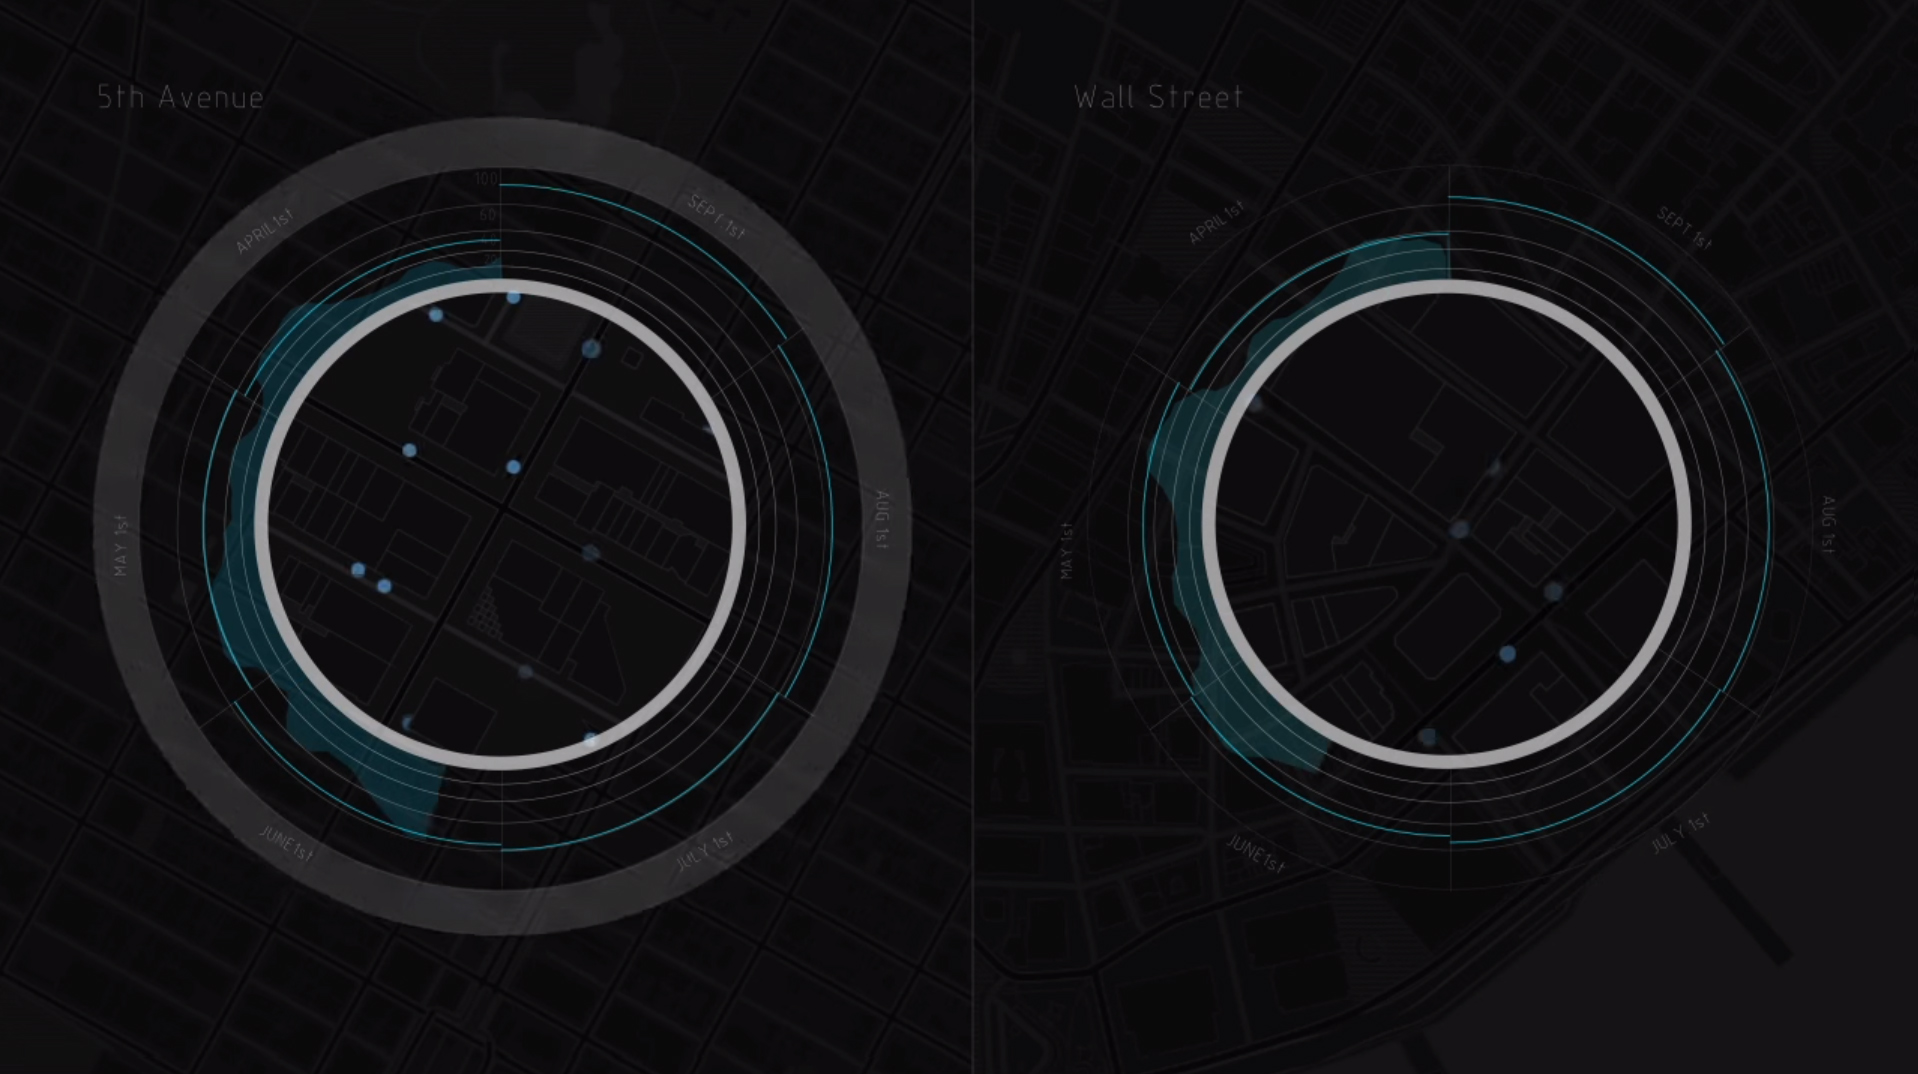
This project is a 2-minute animation evidencing Manhattan’s “pulse” between "Work" in Wall Street and "Play", around 5th Avenue.
Both places experience picks of activity alternatively throughout the day: morning commutes of white collars in the business district in the morning, and rush hour of the nightlife around 5th avenue at 8 PM.
Through the usage of Uber’s drop-off data for 2016, this animation illustrates how understanding and quantifying cities activity is within-reach for architects and urban planners. At the same this work opens the door to the larger question of planning in age of increased mobility and Big Data.