


As the “American Mall” model is experiencing a severe decline in the post-crisis era, a new paradigm might be in its infancy: The Dynamic Store. Although still in its early days, this new paradigm puts elasticity at the heart of new retail business models, while leveraging and scaling up the pop-store experience.
Contrasting with the rigidity of the traditional department store, its internal organization would rely on a modular system of partitions and furniture. This flexible infrastructure, coupled with the analytical forecast of users’ behavior and traffic, would enable malls to embrace flexibility as their new ecology. As activities and users’ traffic change throughout the day, the week or the year, so would the dynamic store, adapting its layout to evolving usage. The stores’ leases themselves would then be reduced to shorter time spans and their terms adjusted to offer greater flexibility to tenants. Overall this new building conception positions flexibility as the corner-stone of its daily routine, leaning on modularity and prediction as the means to achieve it.
Flexible Infrastructure
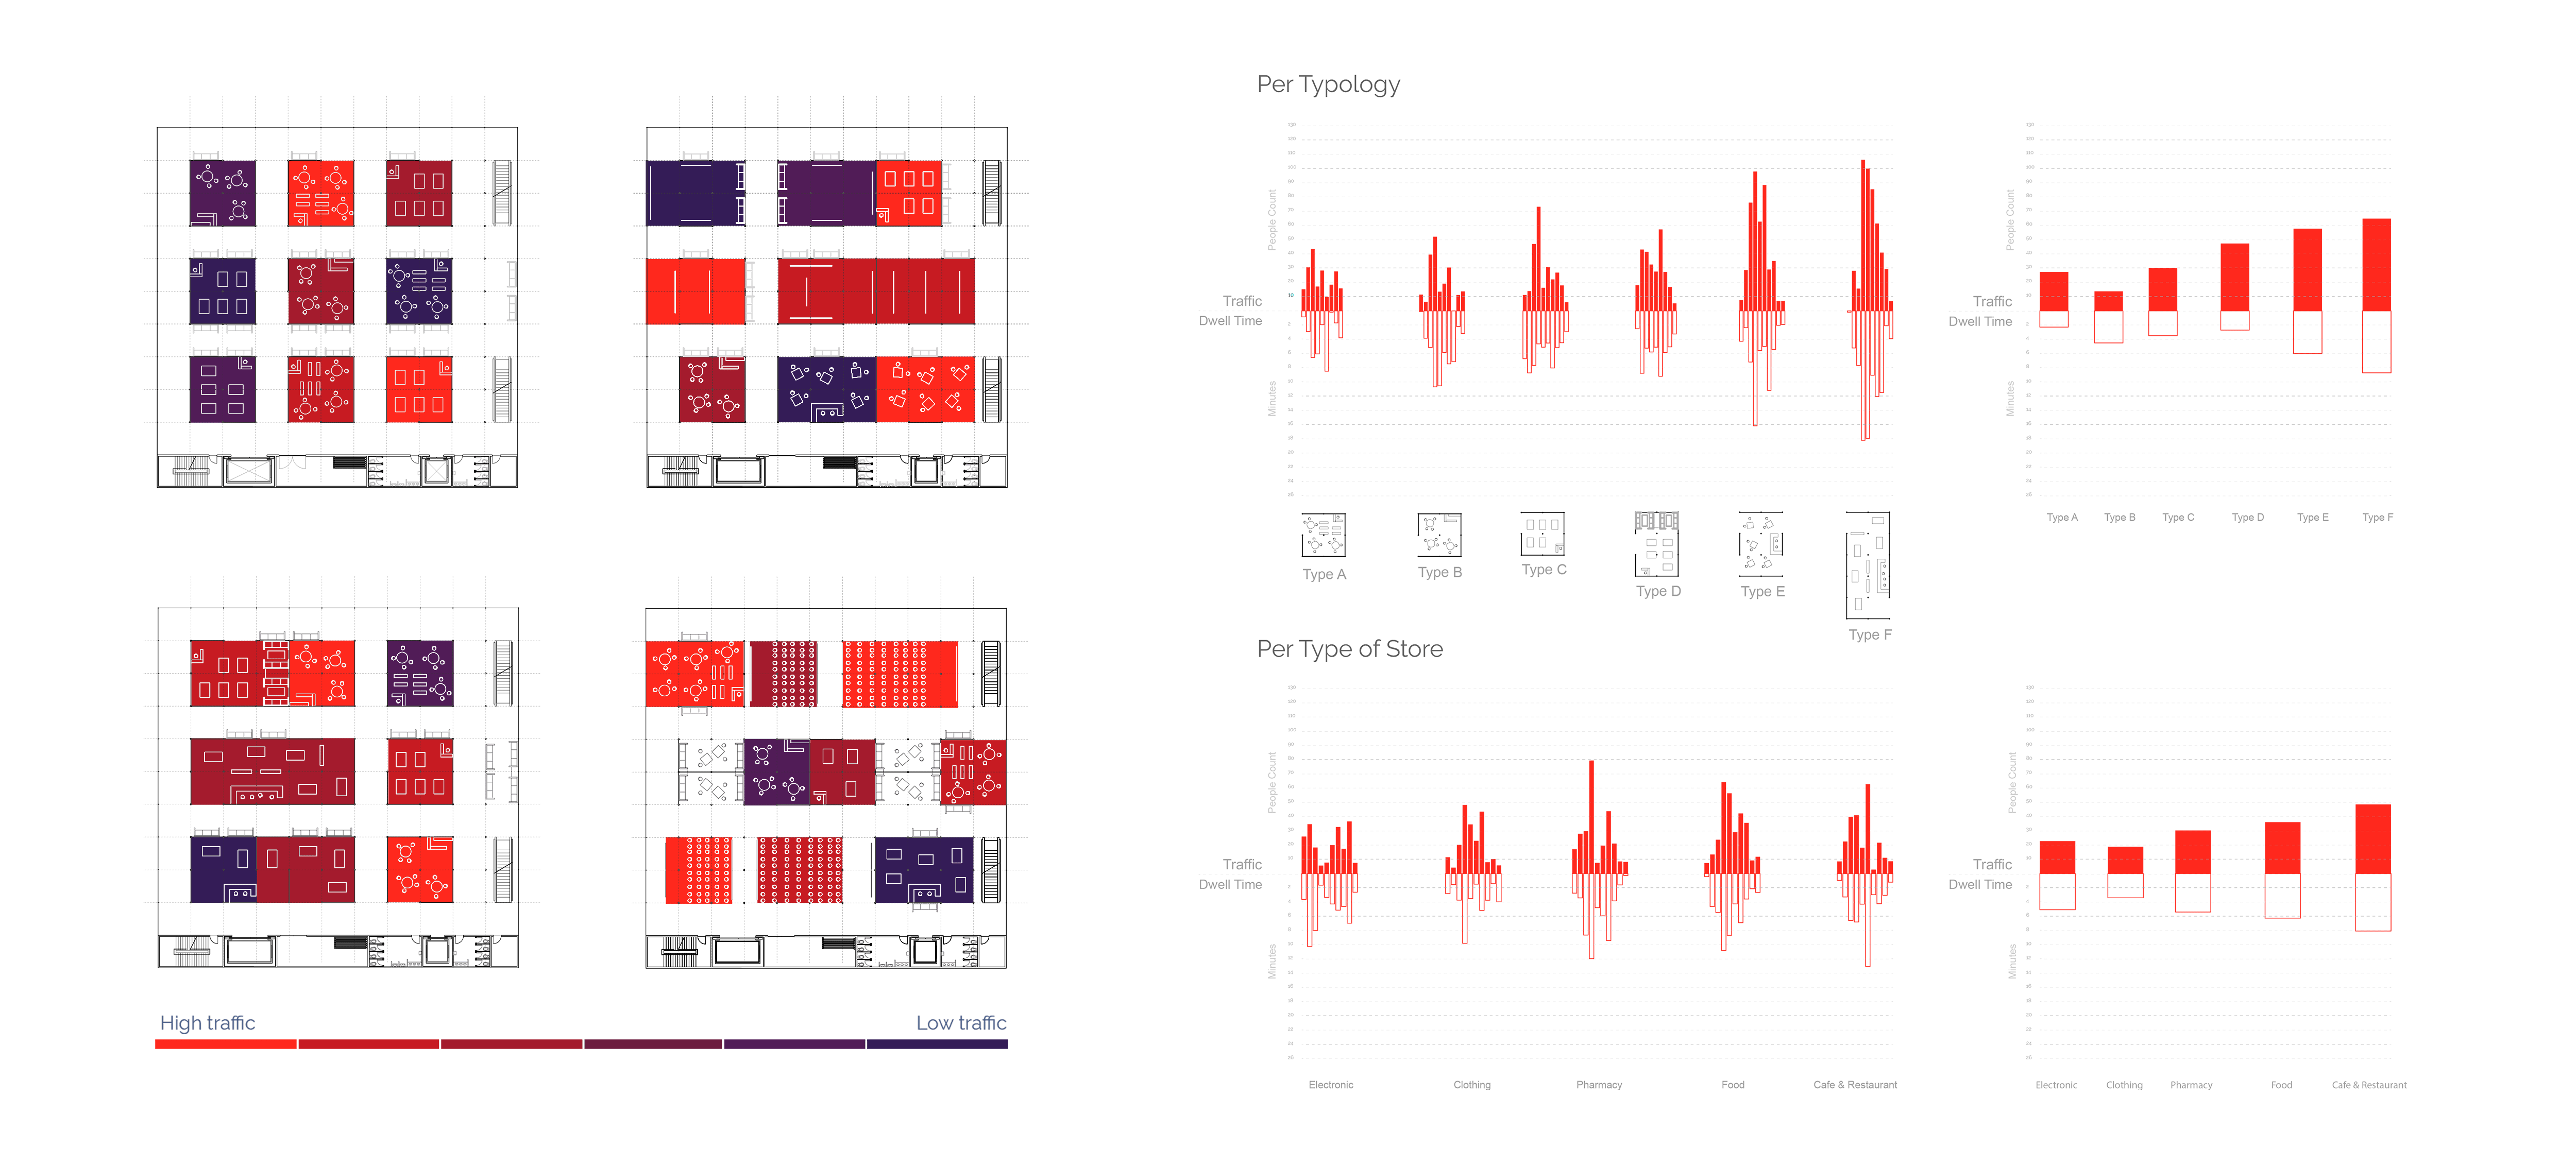
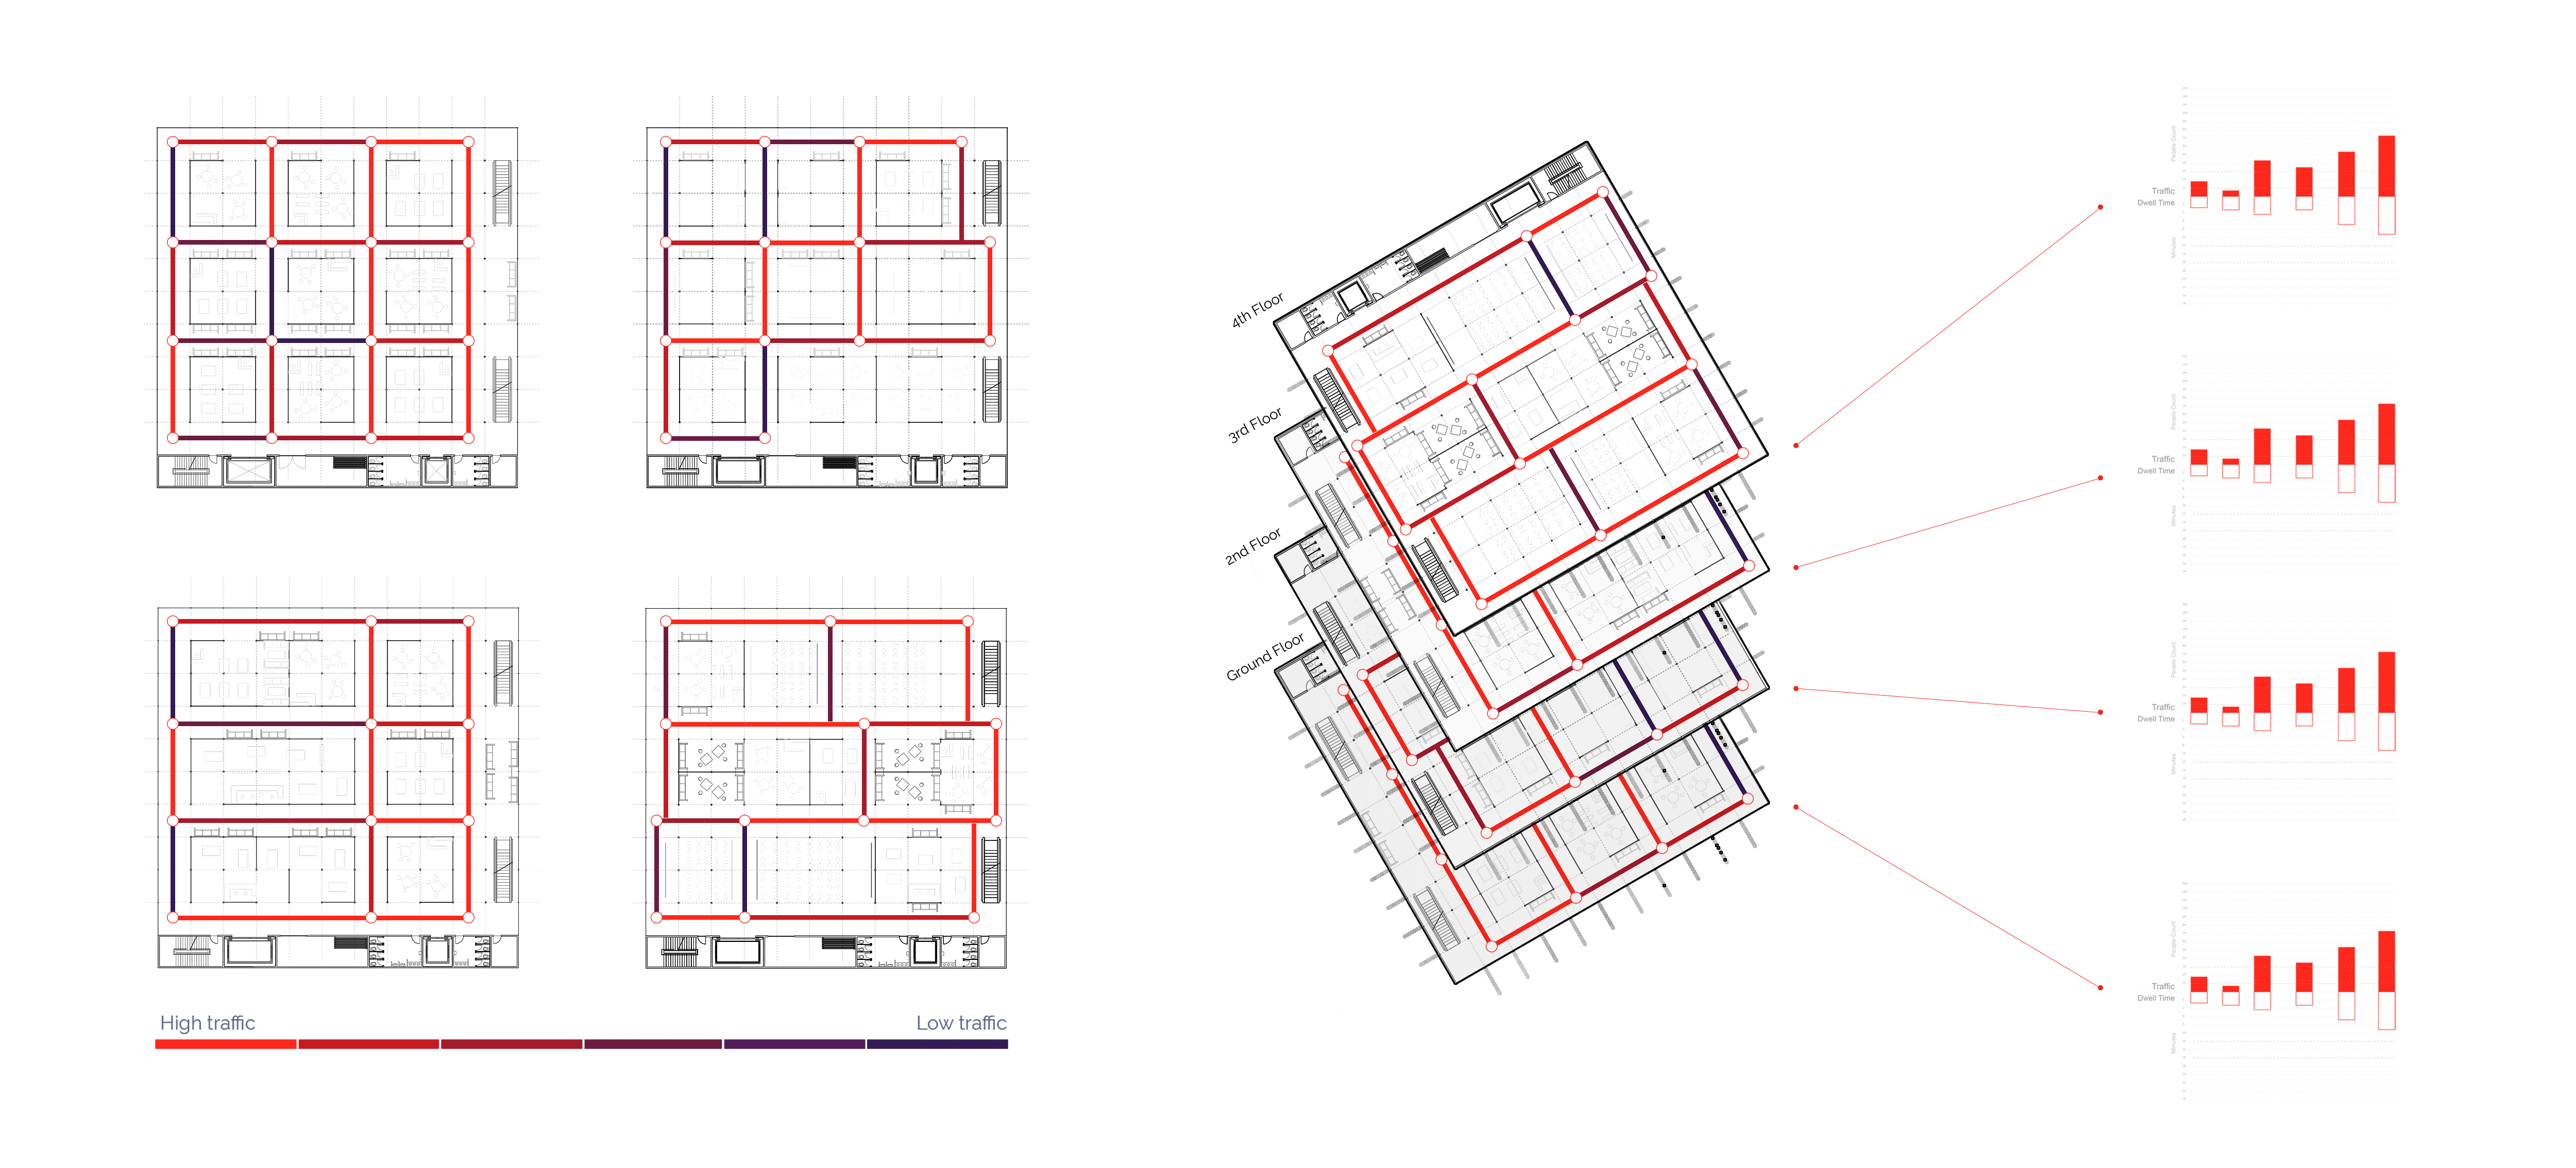
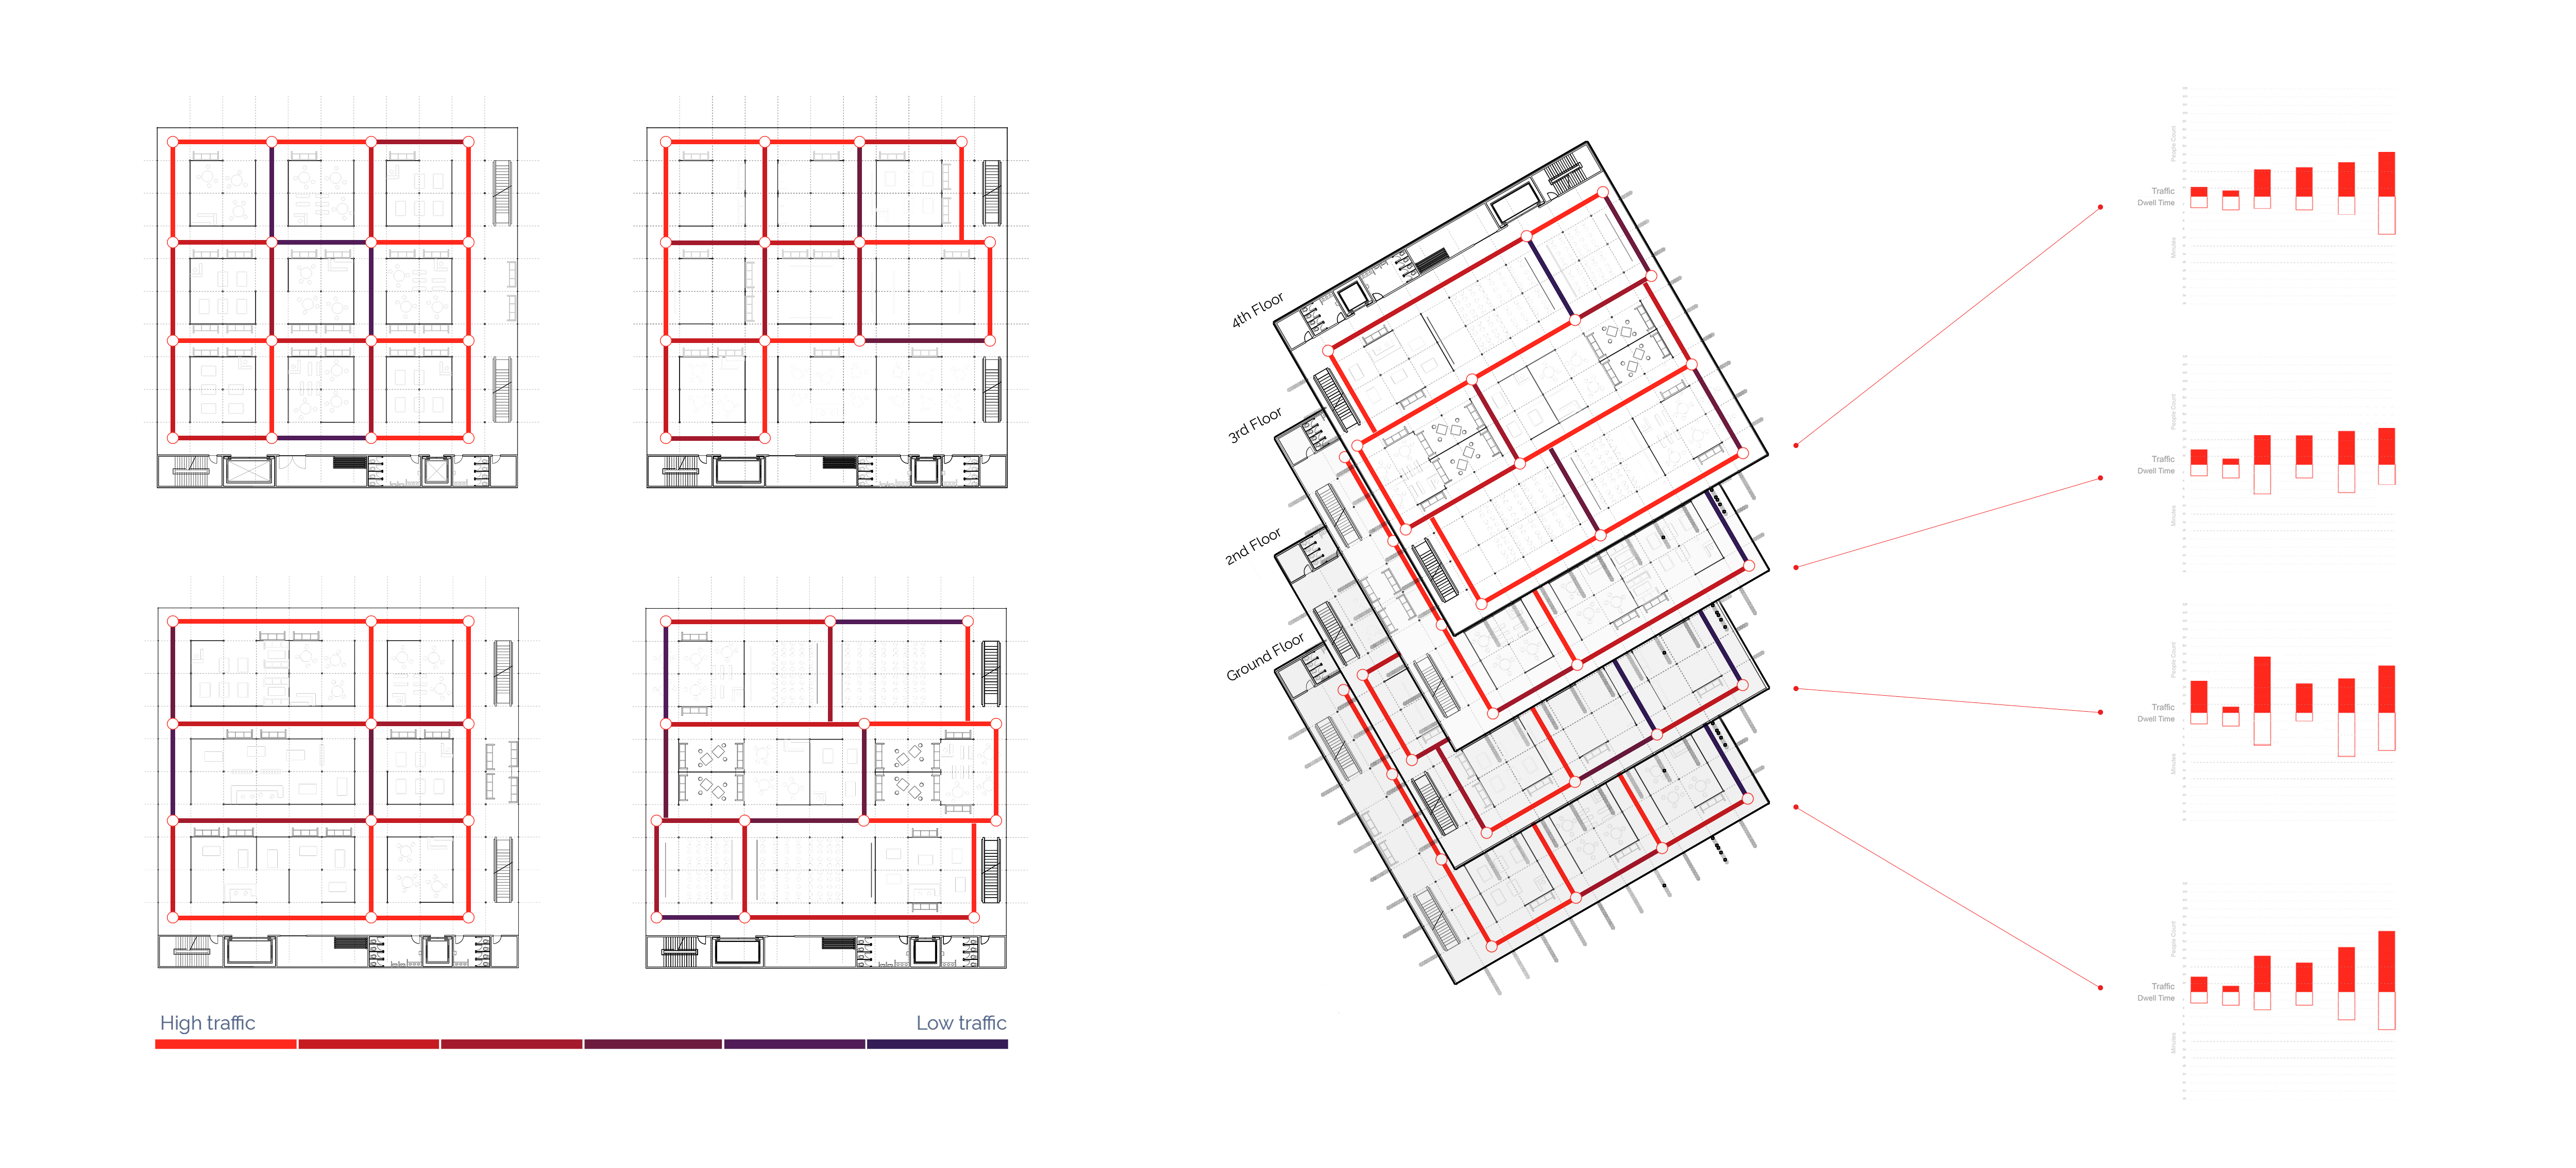
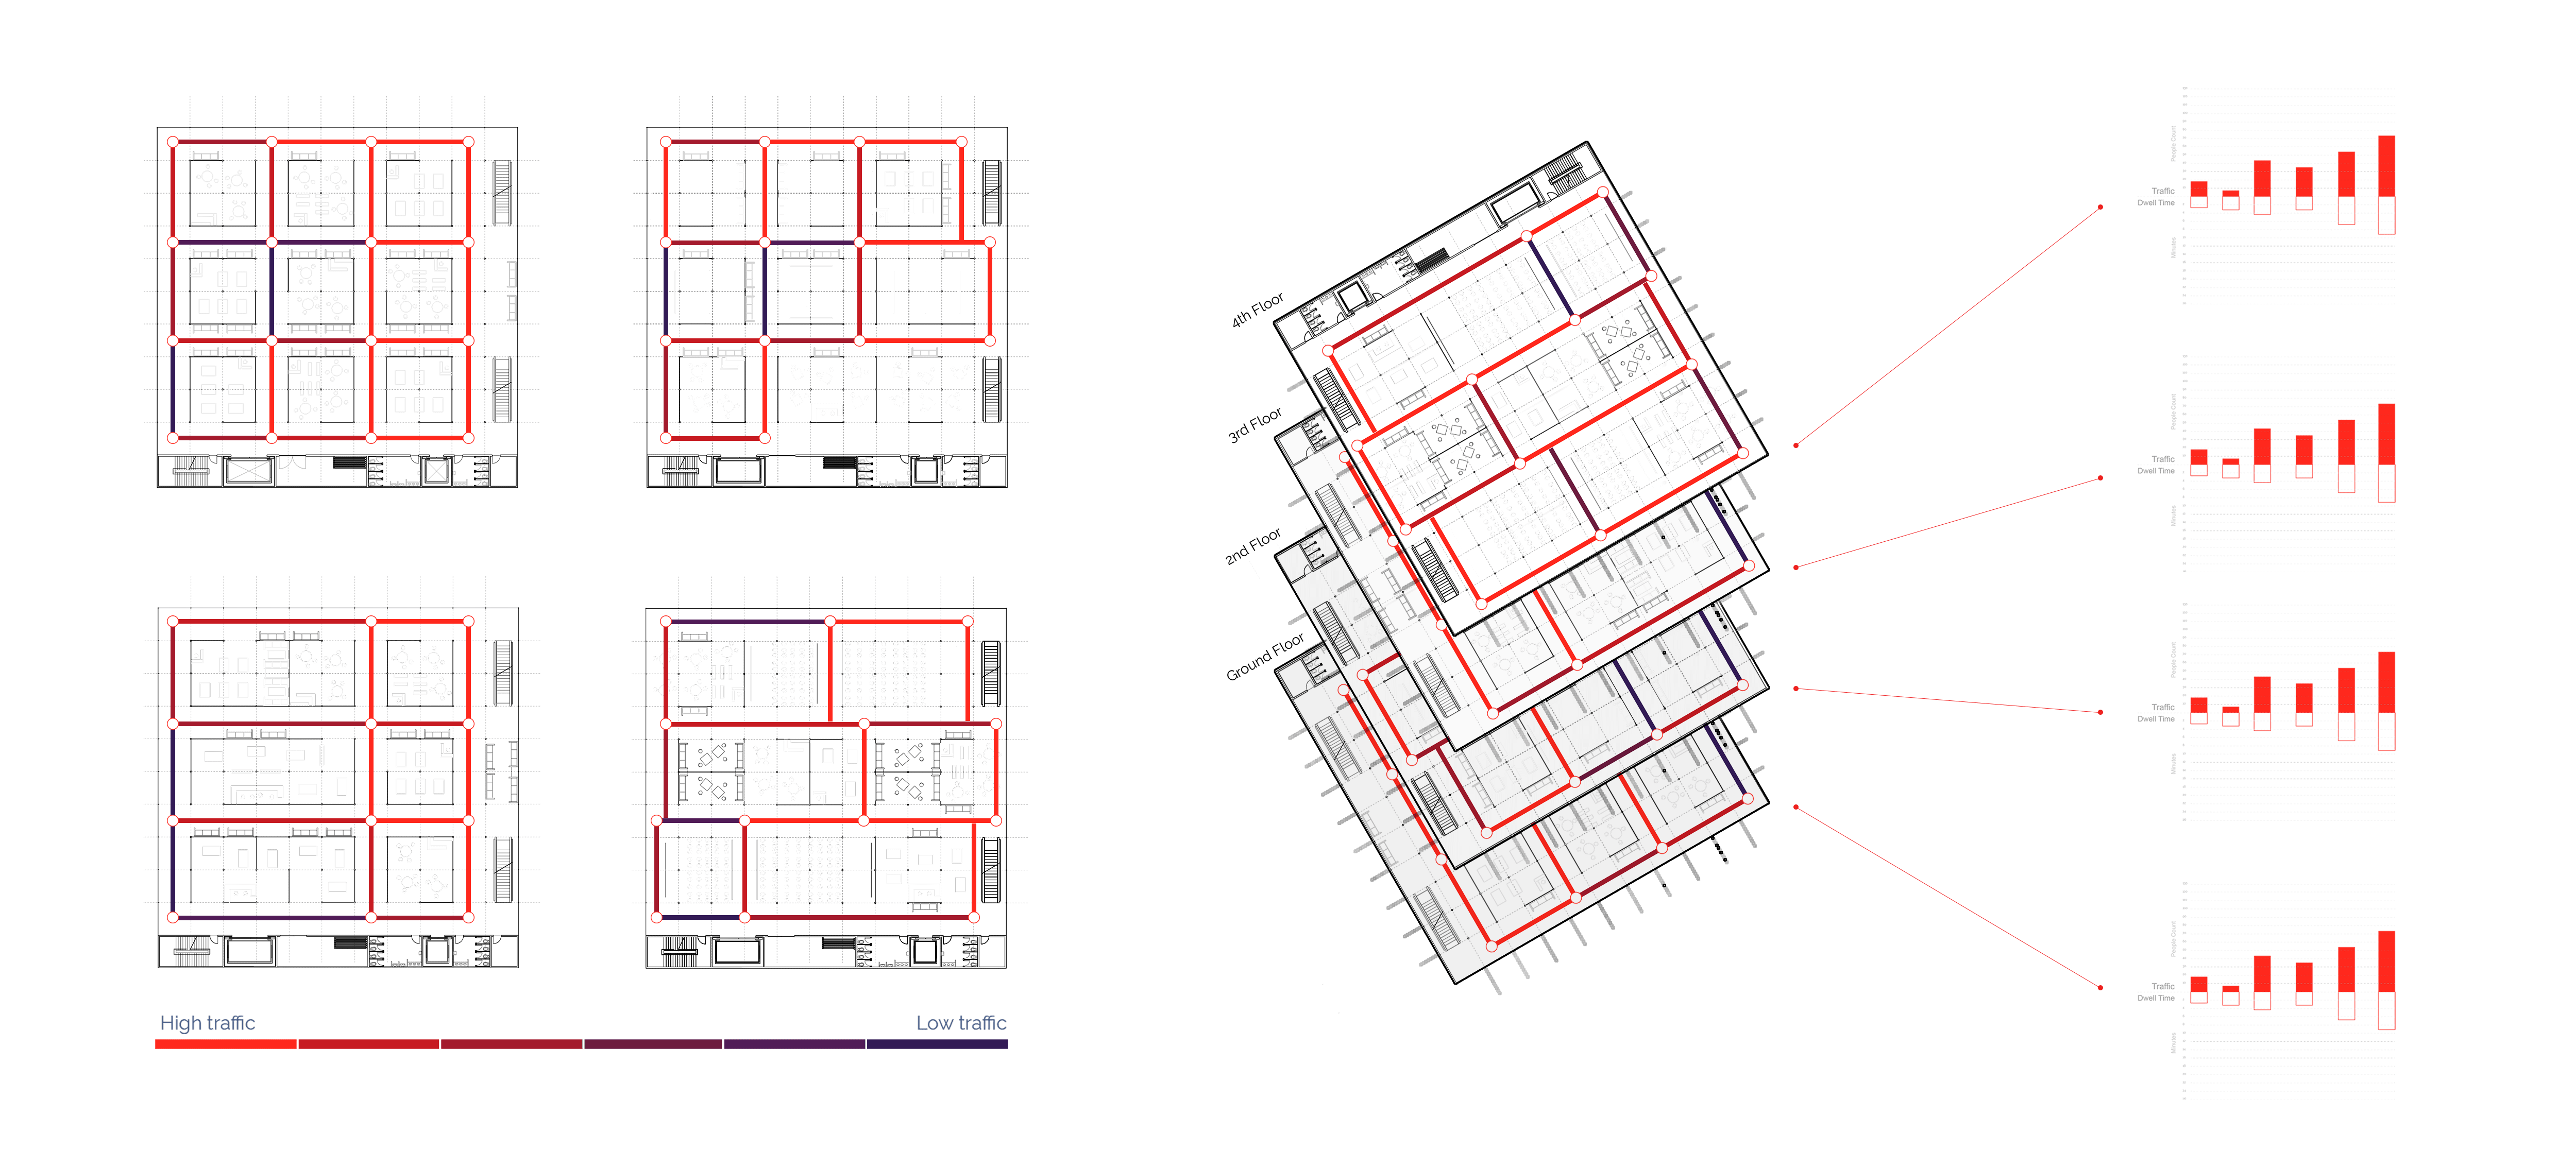
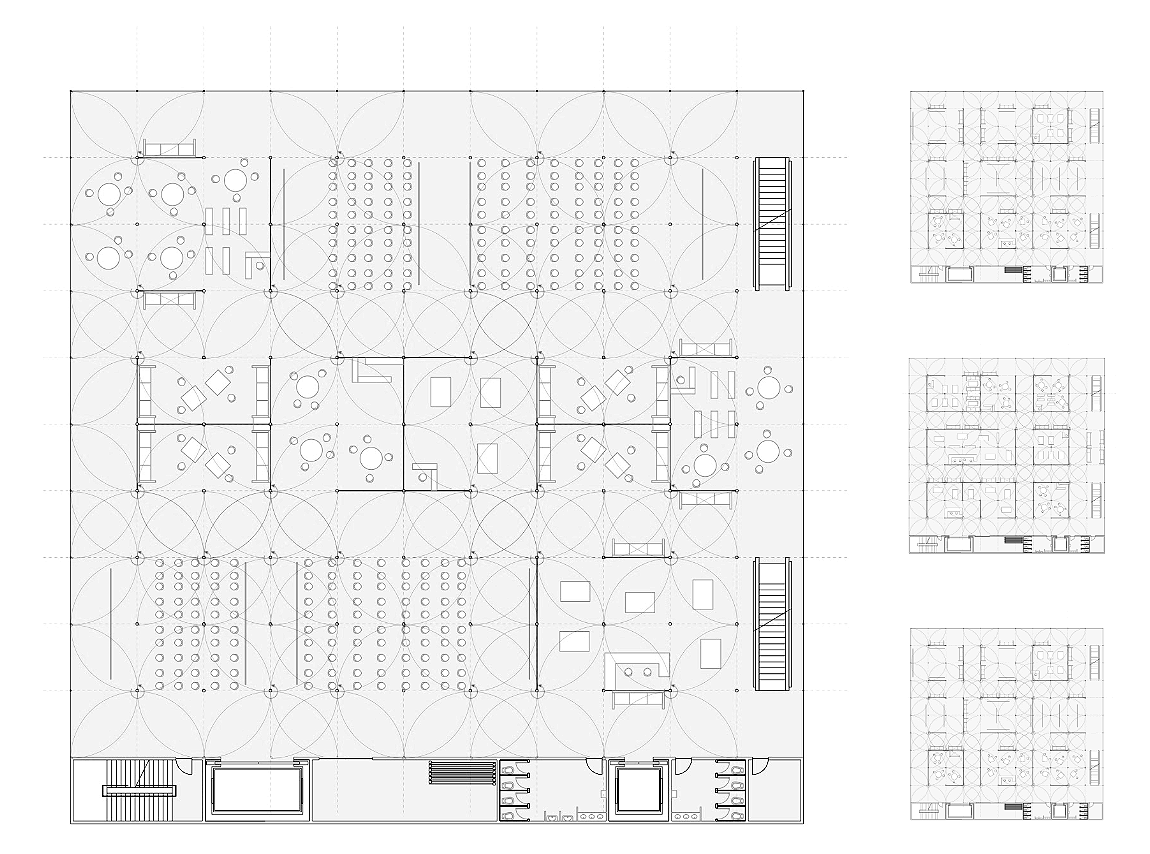
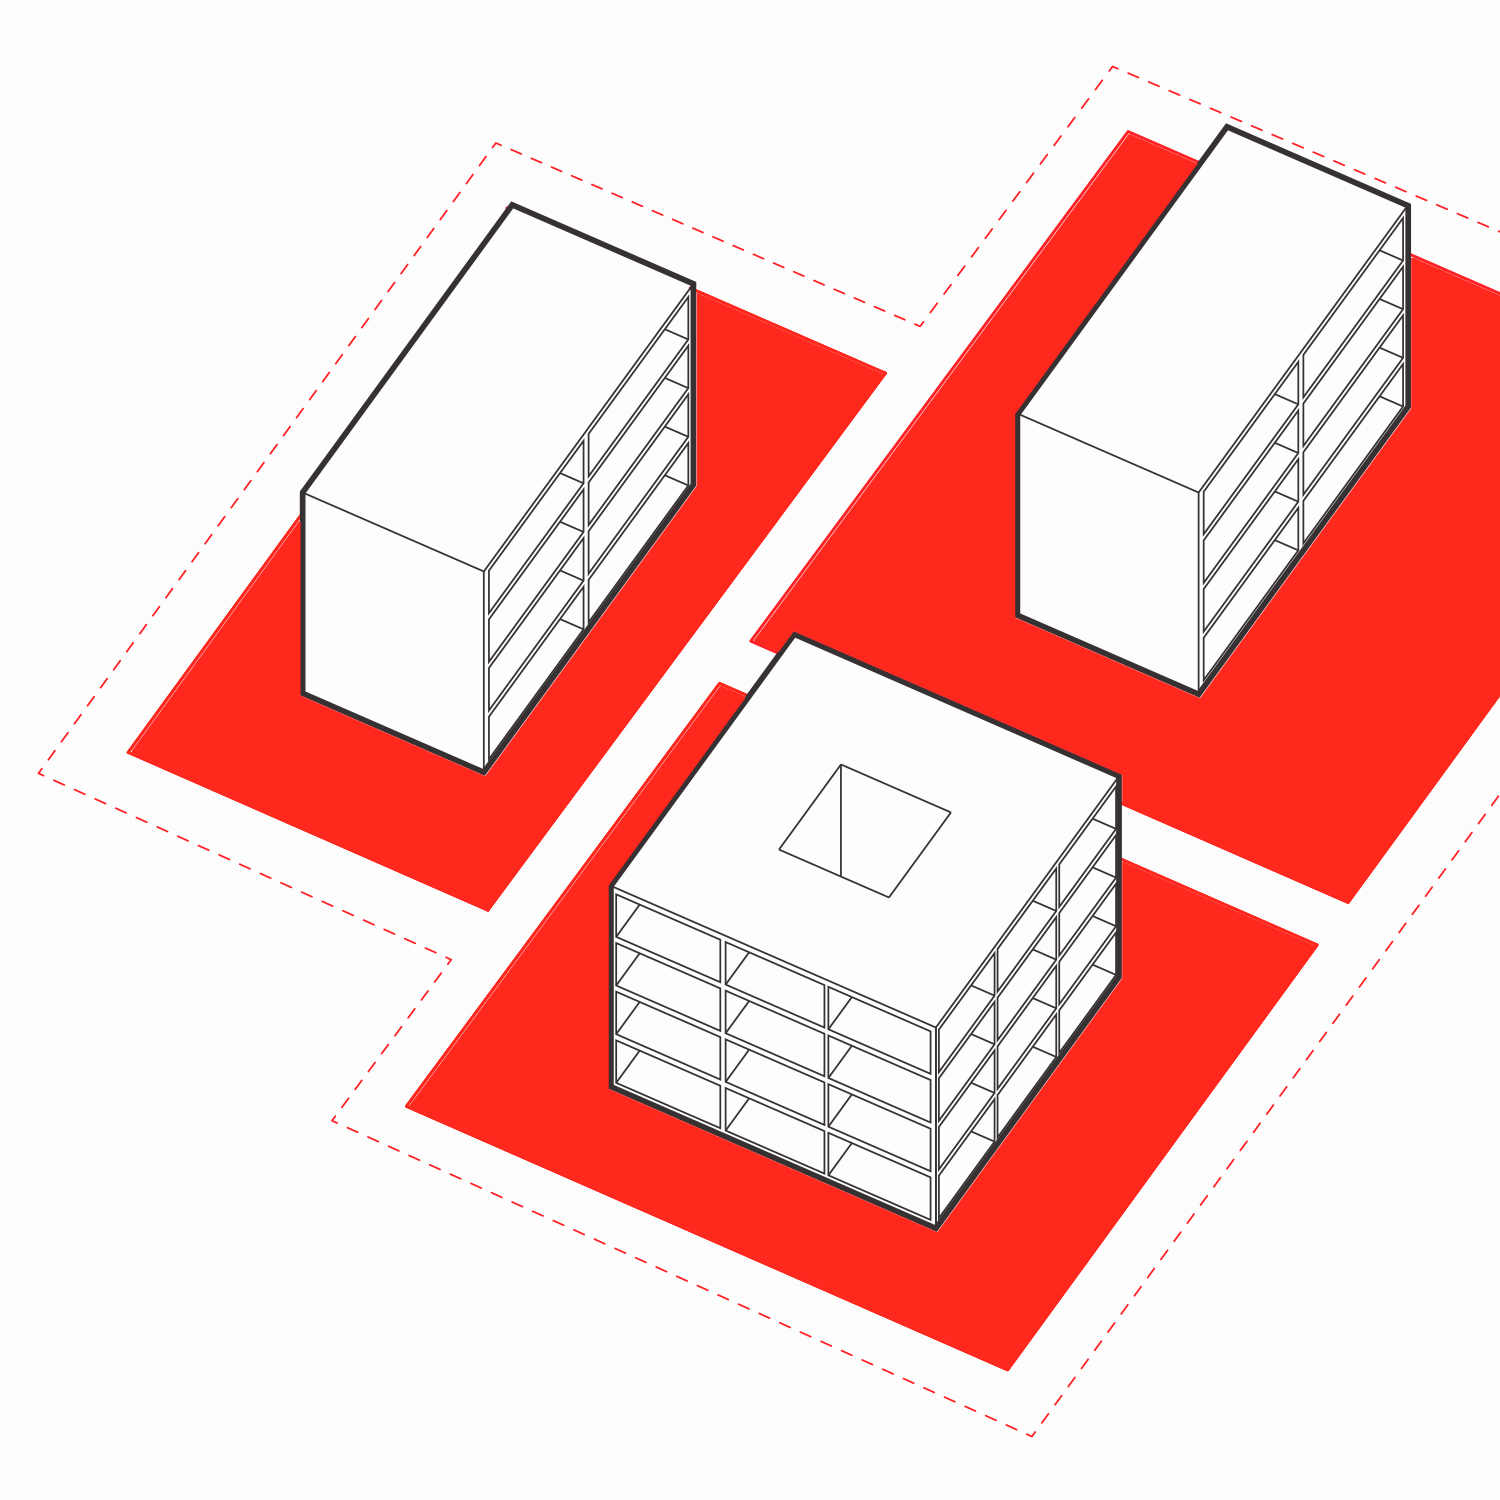
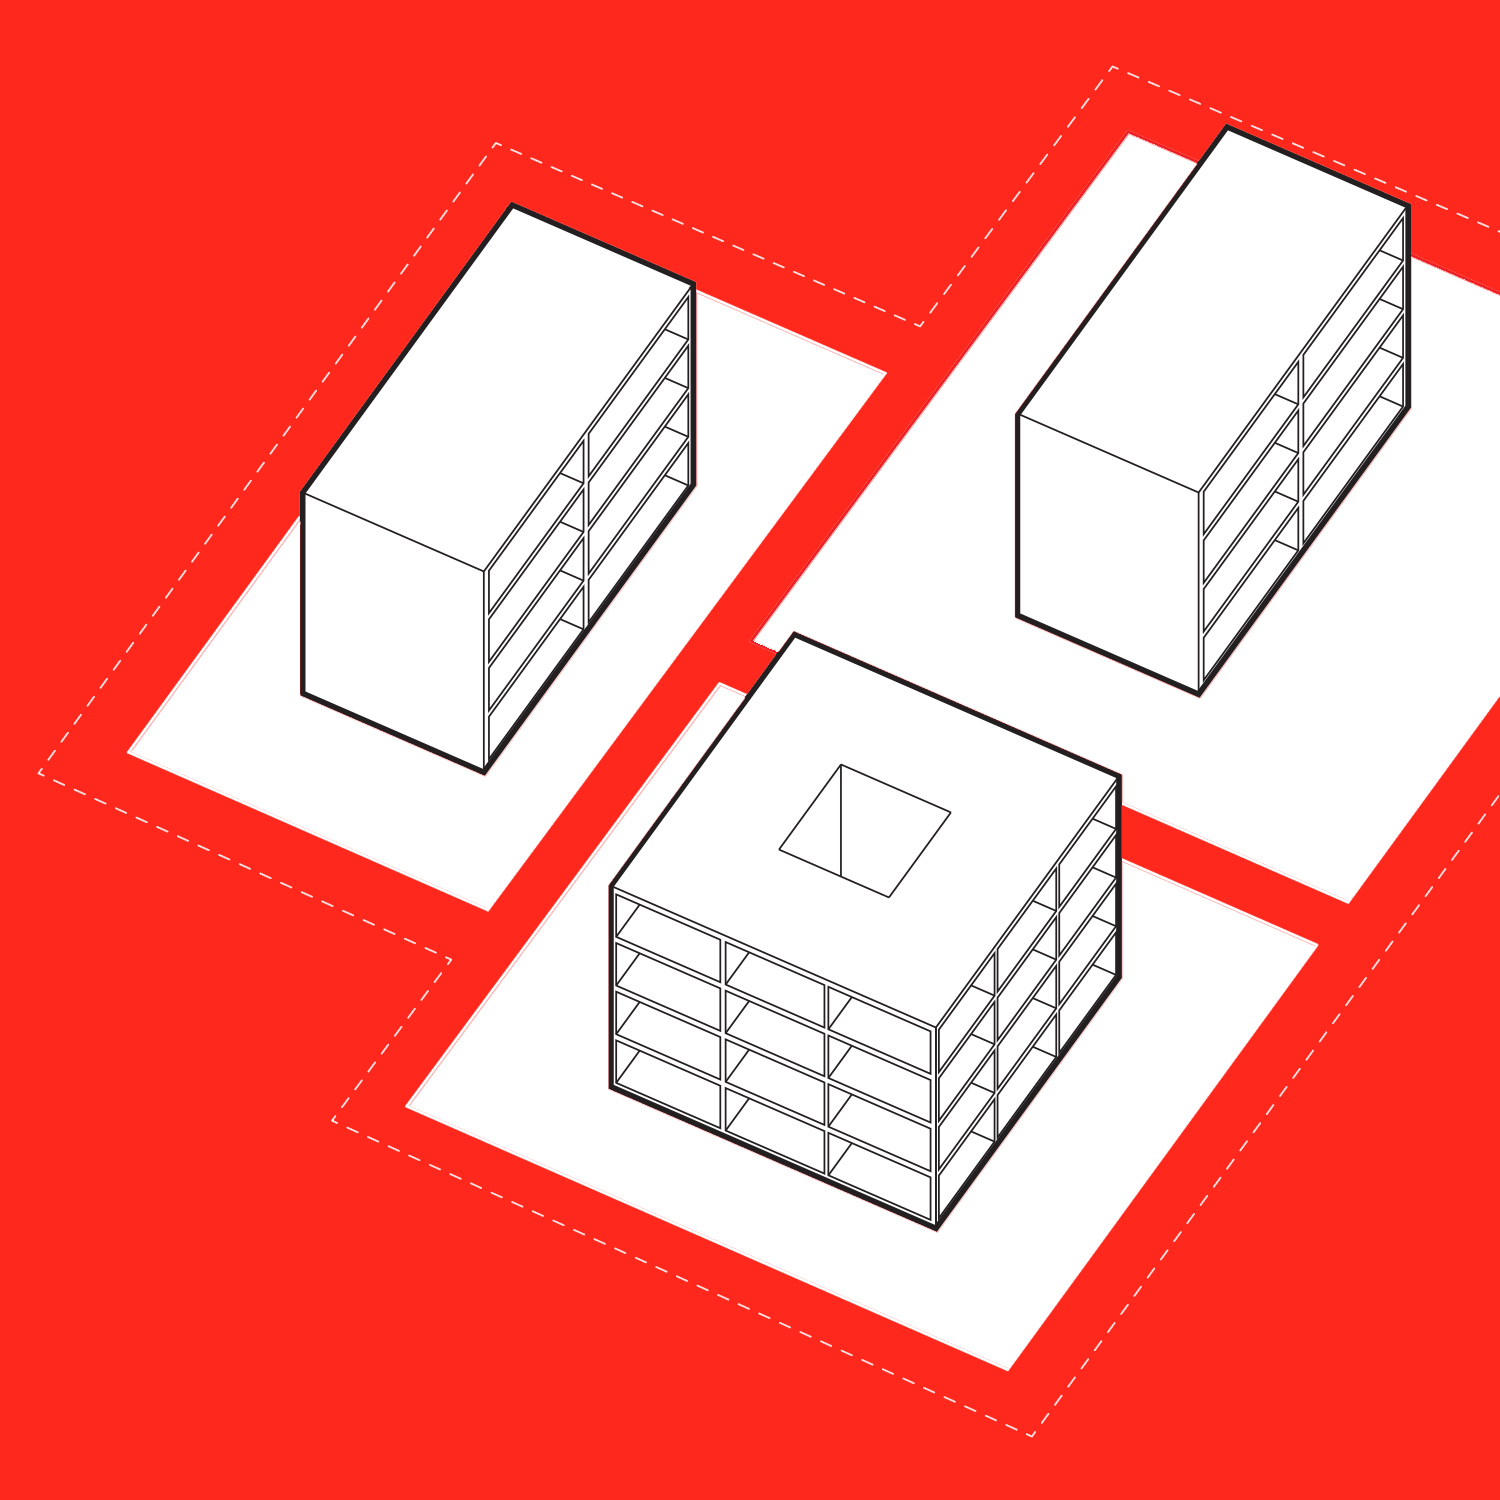
In our project, a typical dynamic mall offers a different space layout for each floor while using a unique modular system of partitions. The store displays 16 different type of “cell”, each one filling and organizing differently a typical 8 by 8 meters module: from a small store-like layout, to a recreational area with couches, all the way down to a simple circulation corridor.
The 8*8 dimension of the module is a direct reflection of the structural span between columns, dimension that have proven to be ideal in the retail sector to allow for maximum flexibility. The 16 possible furnishing options of this 8 by 8 module have been designed to accommodate any type of function, while minimizing the amount of possible options. These options are used throughout the building and laid out in the space to answer to the forecasted activities and traffic.
Metrics
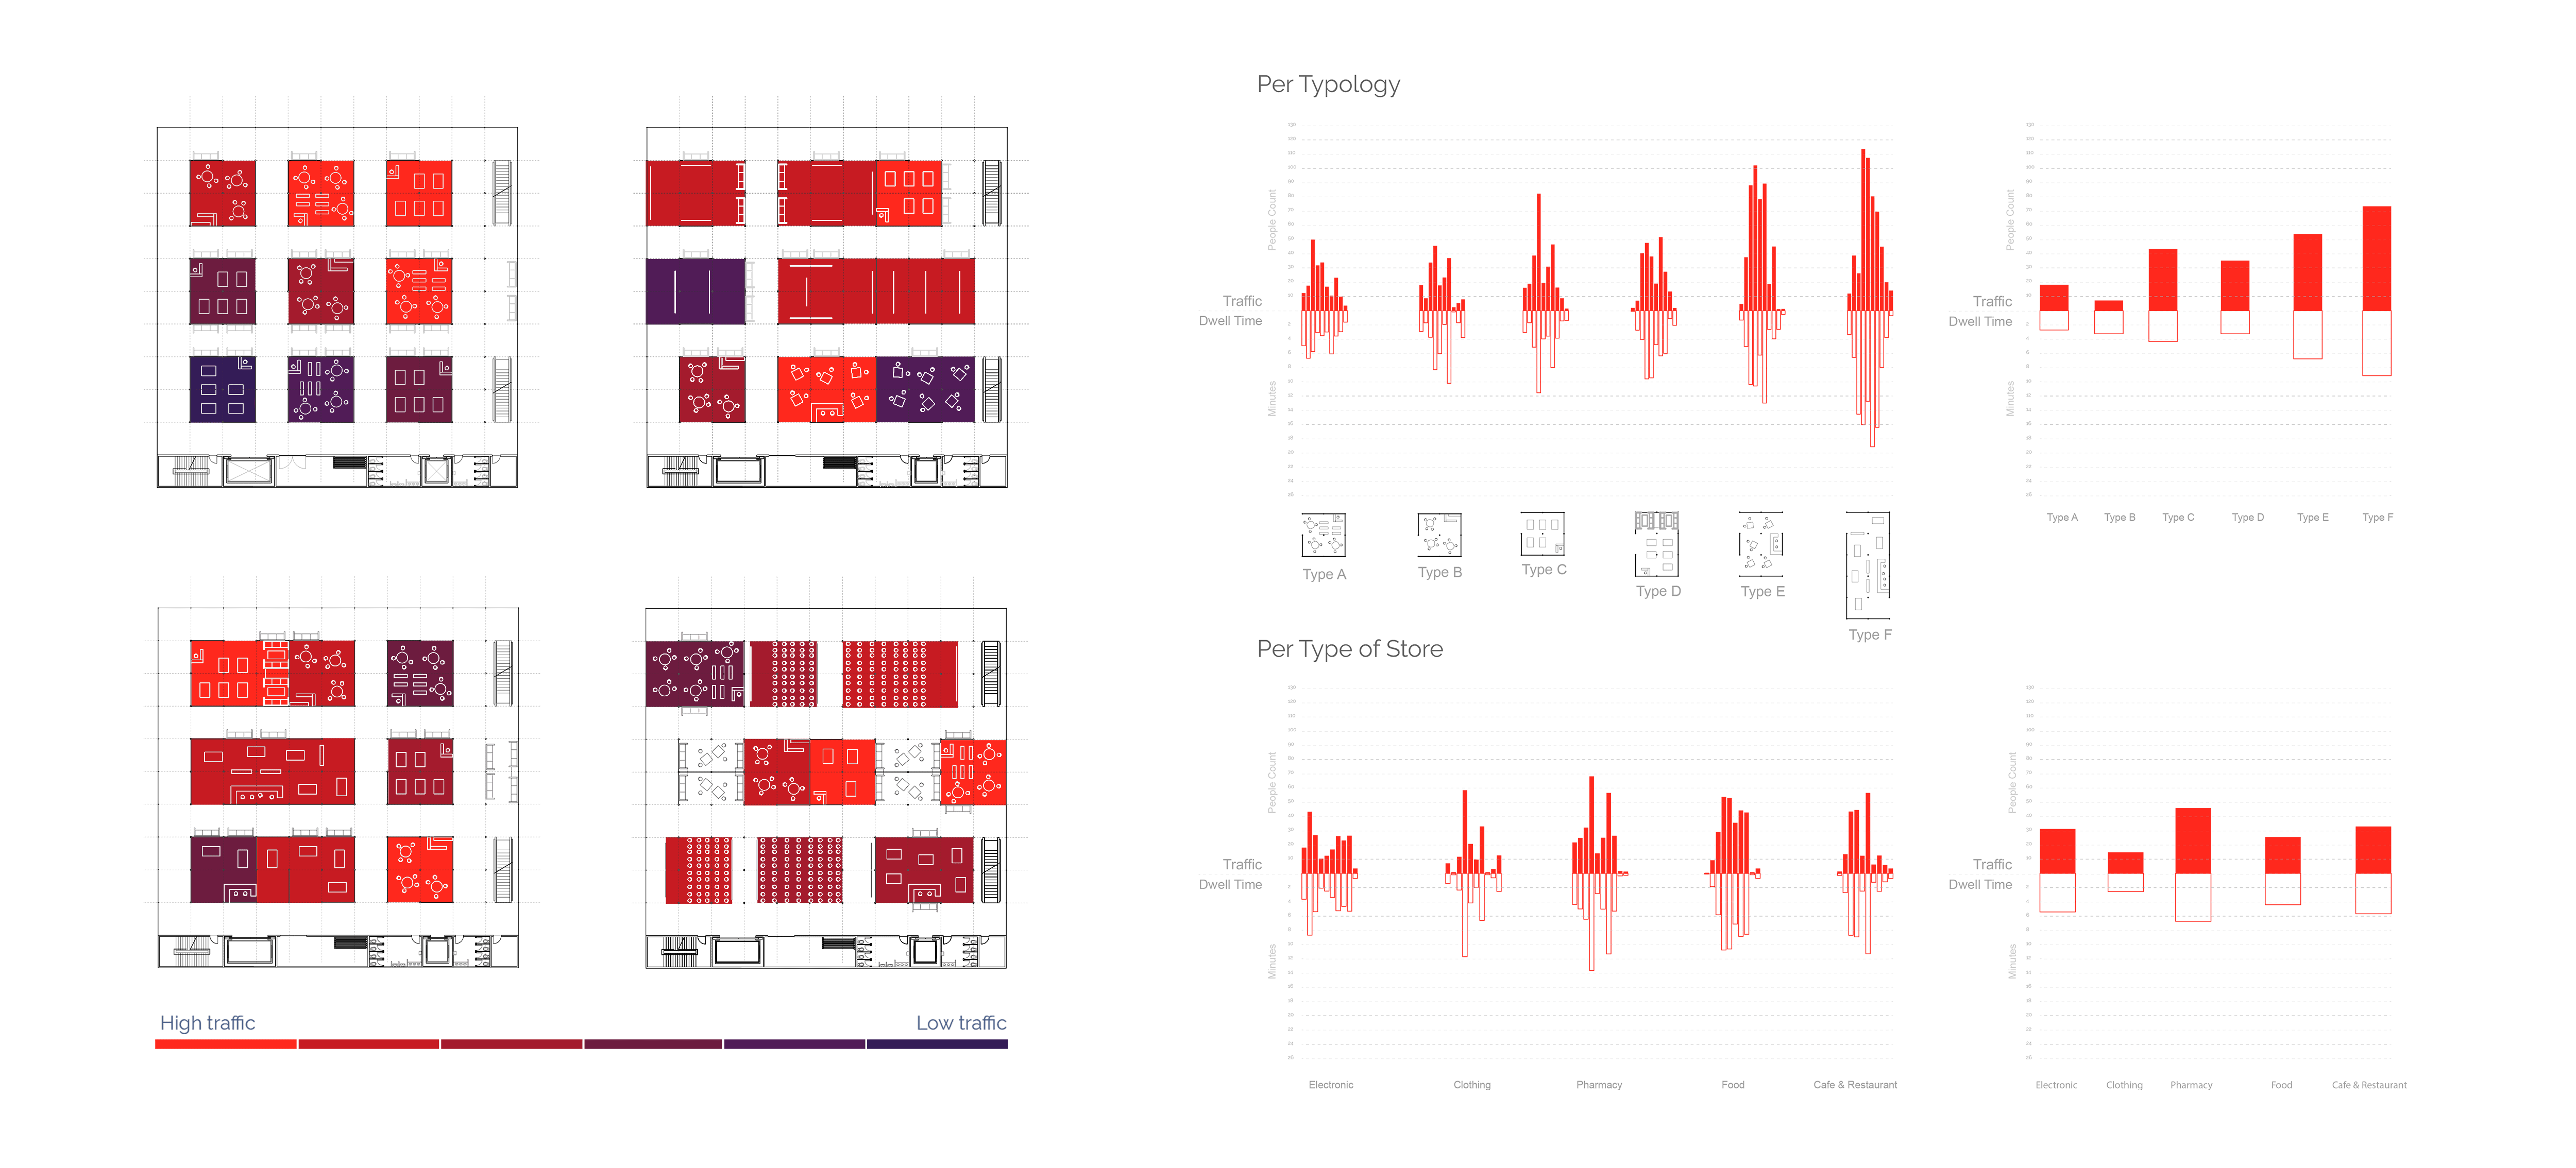
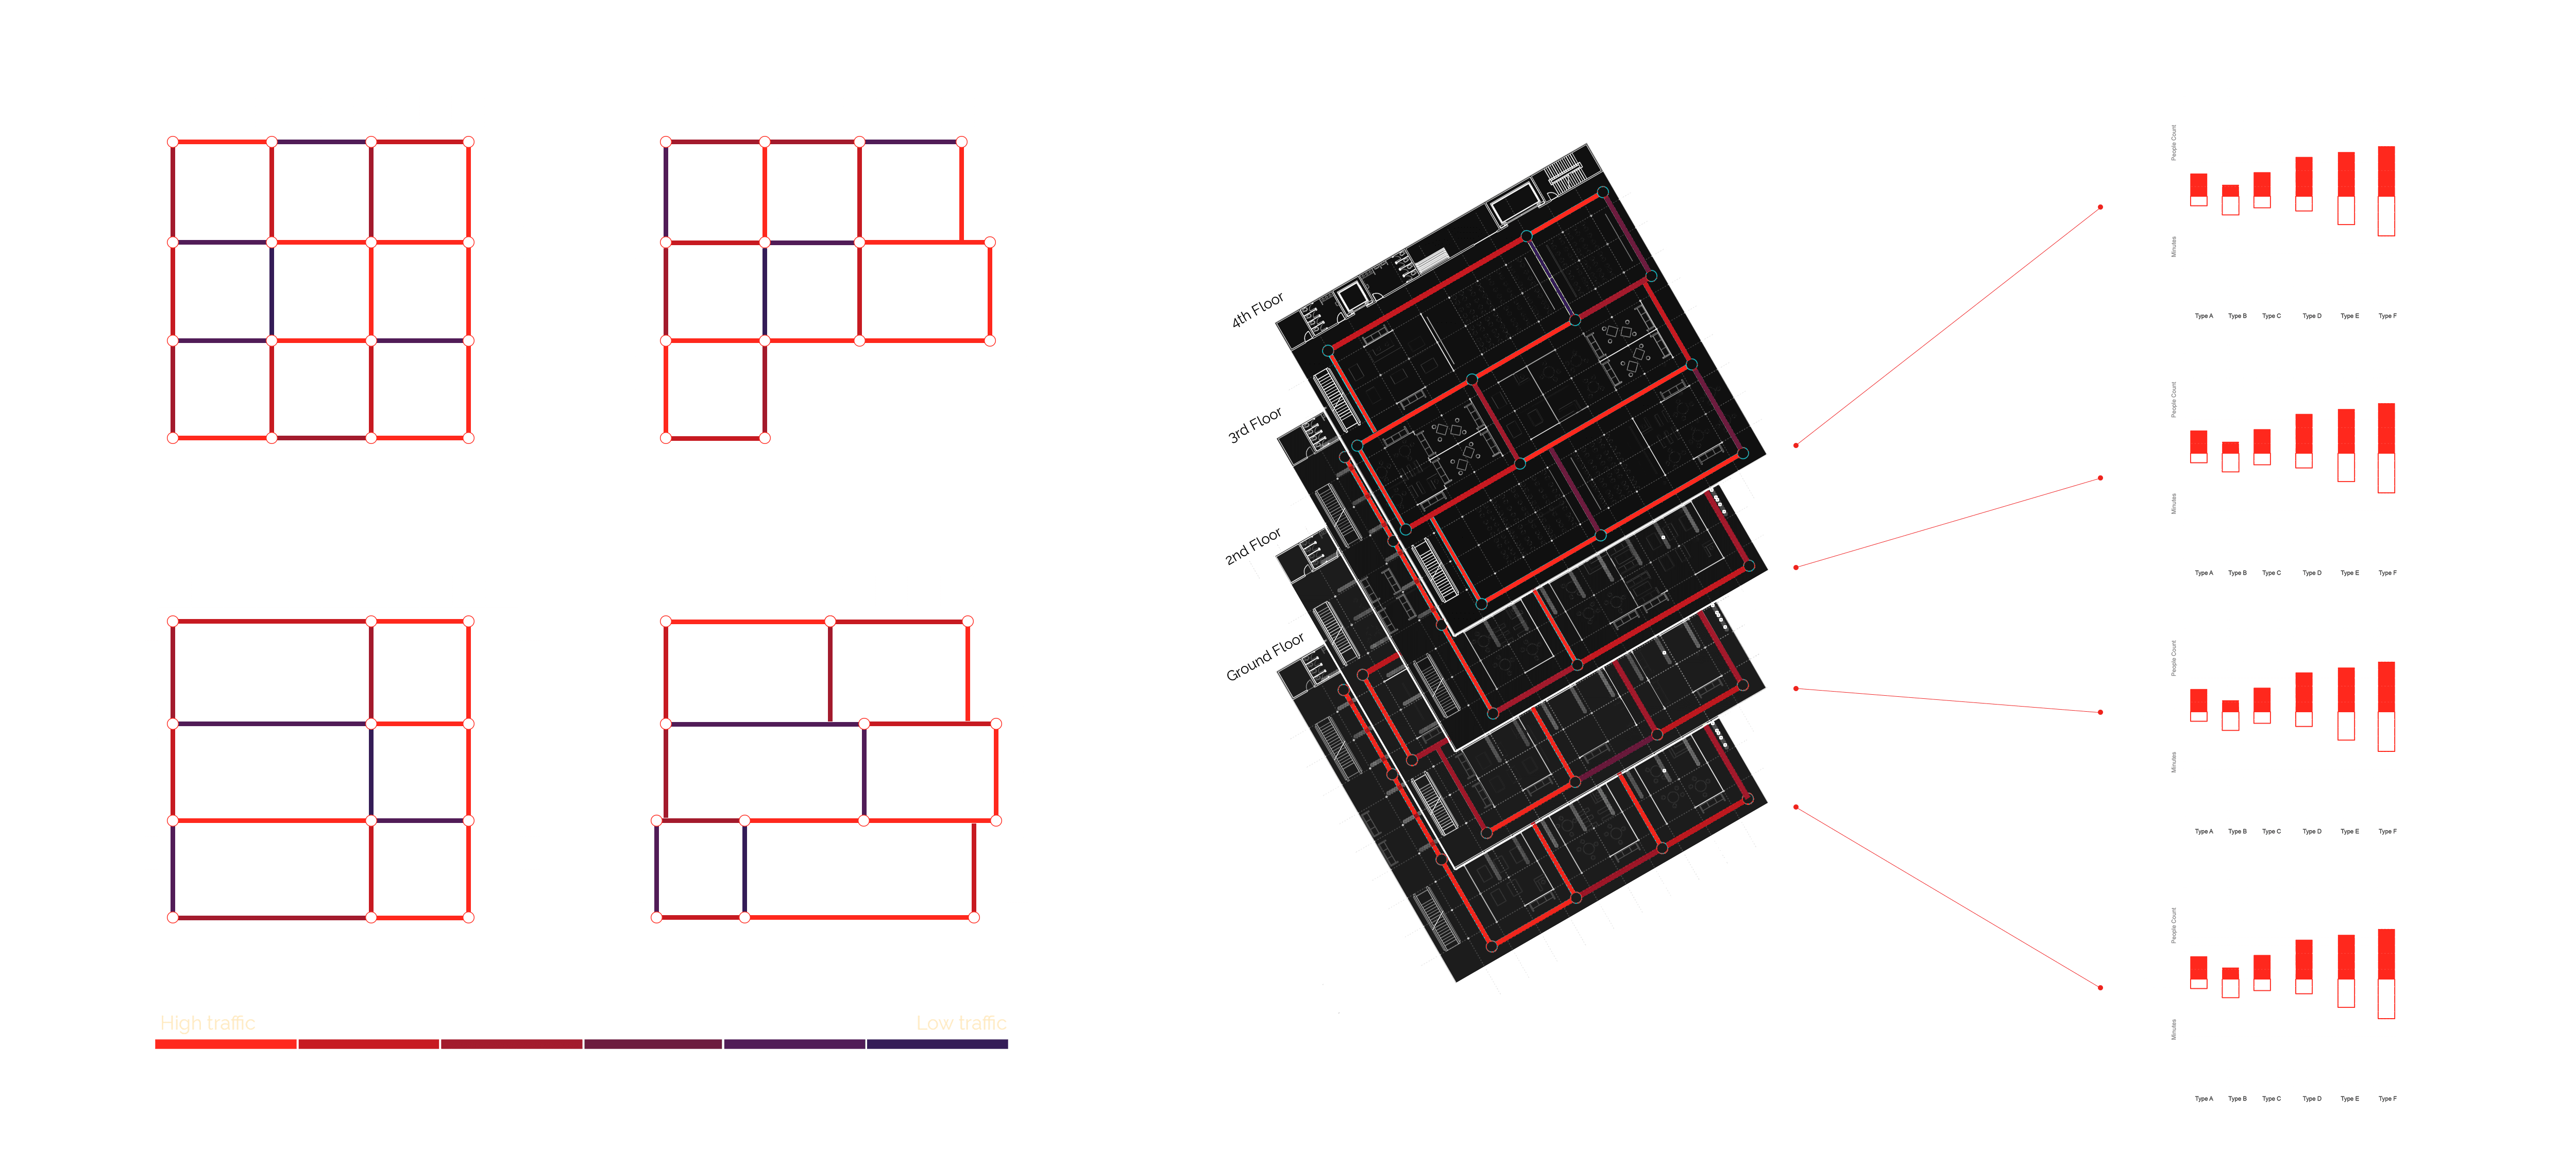
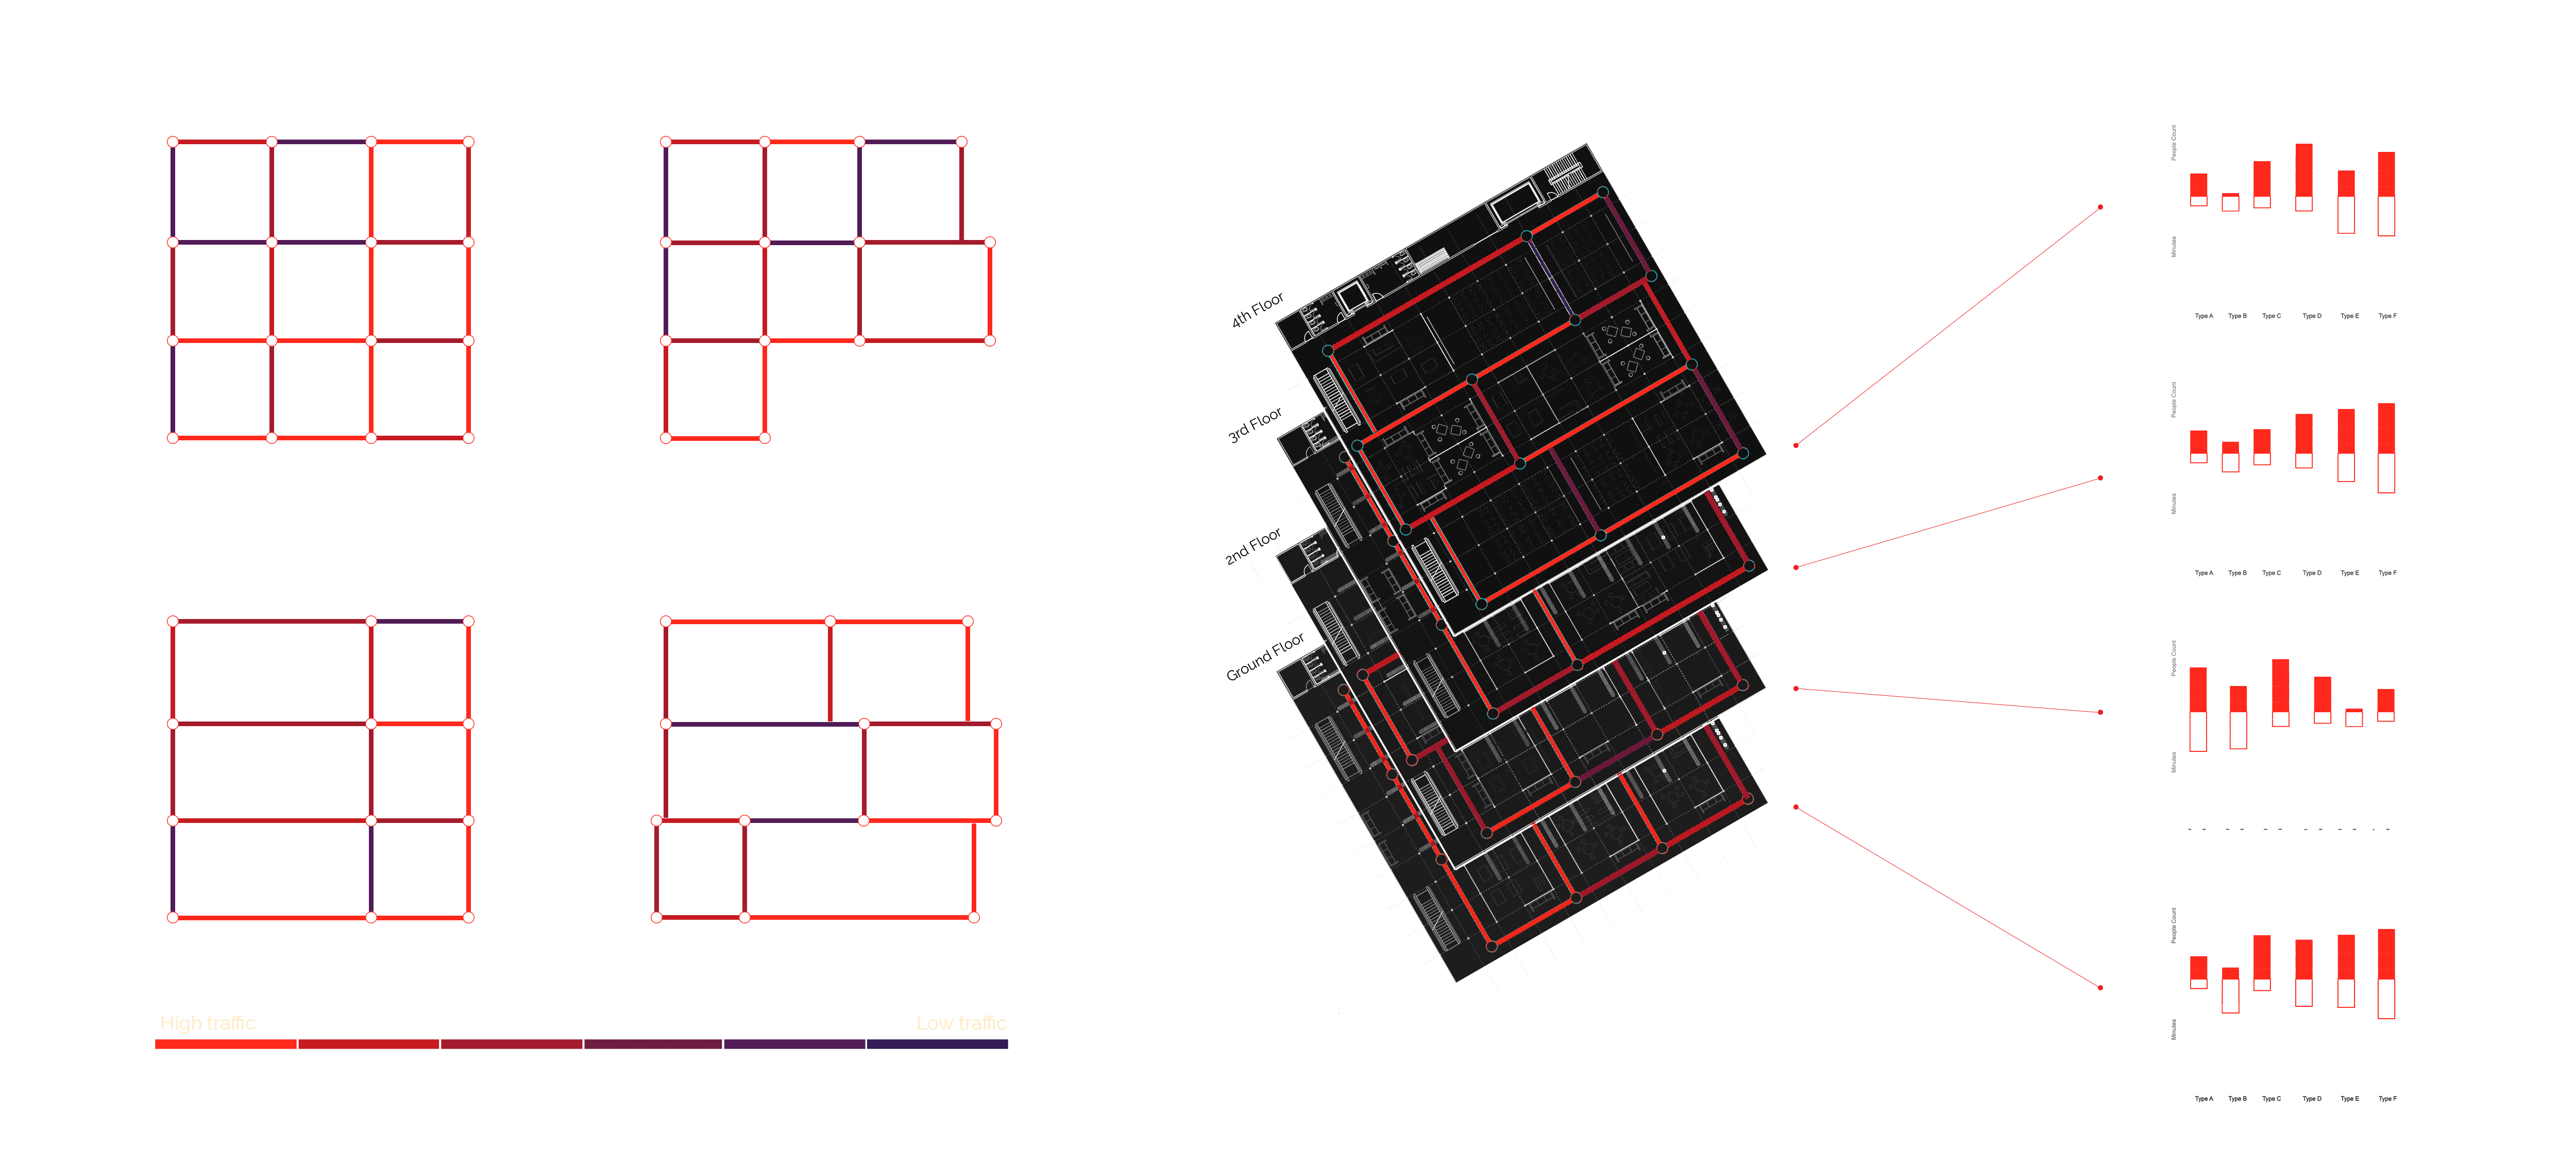
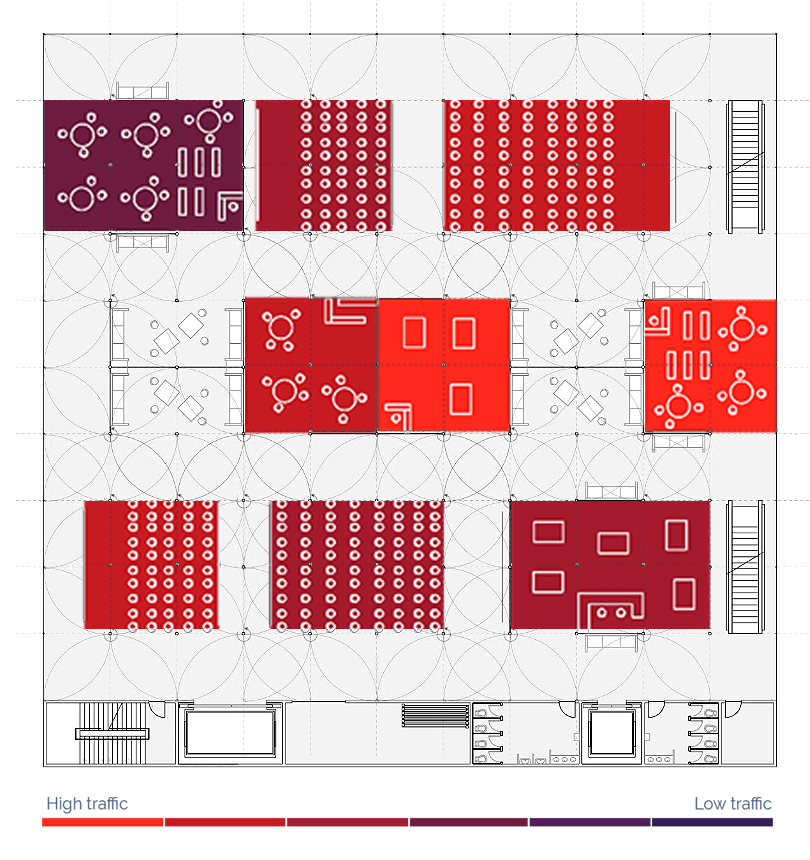
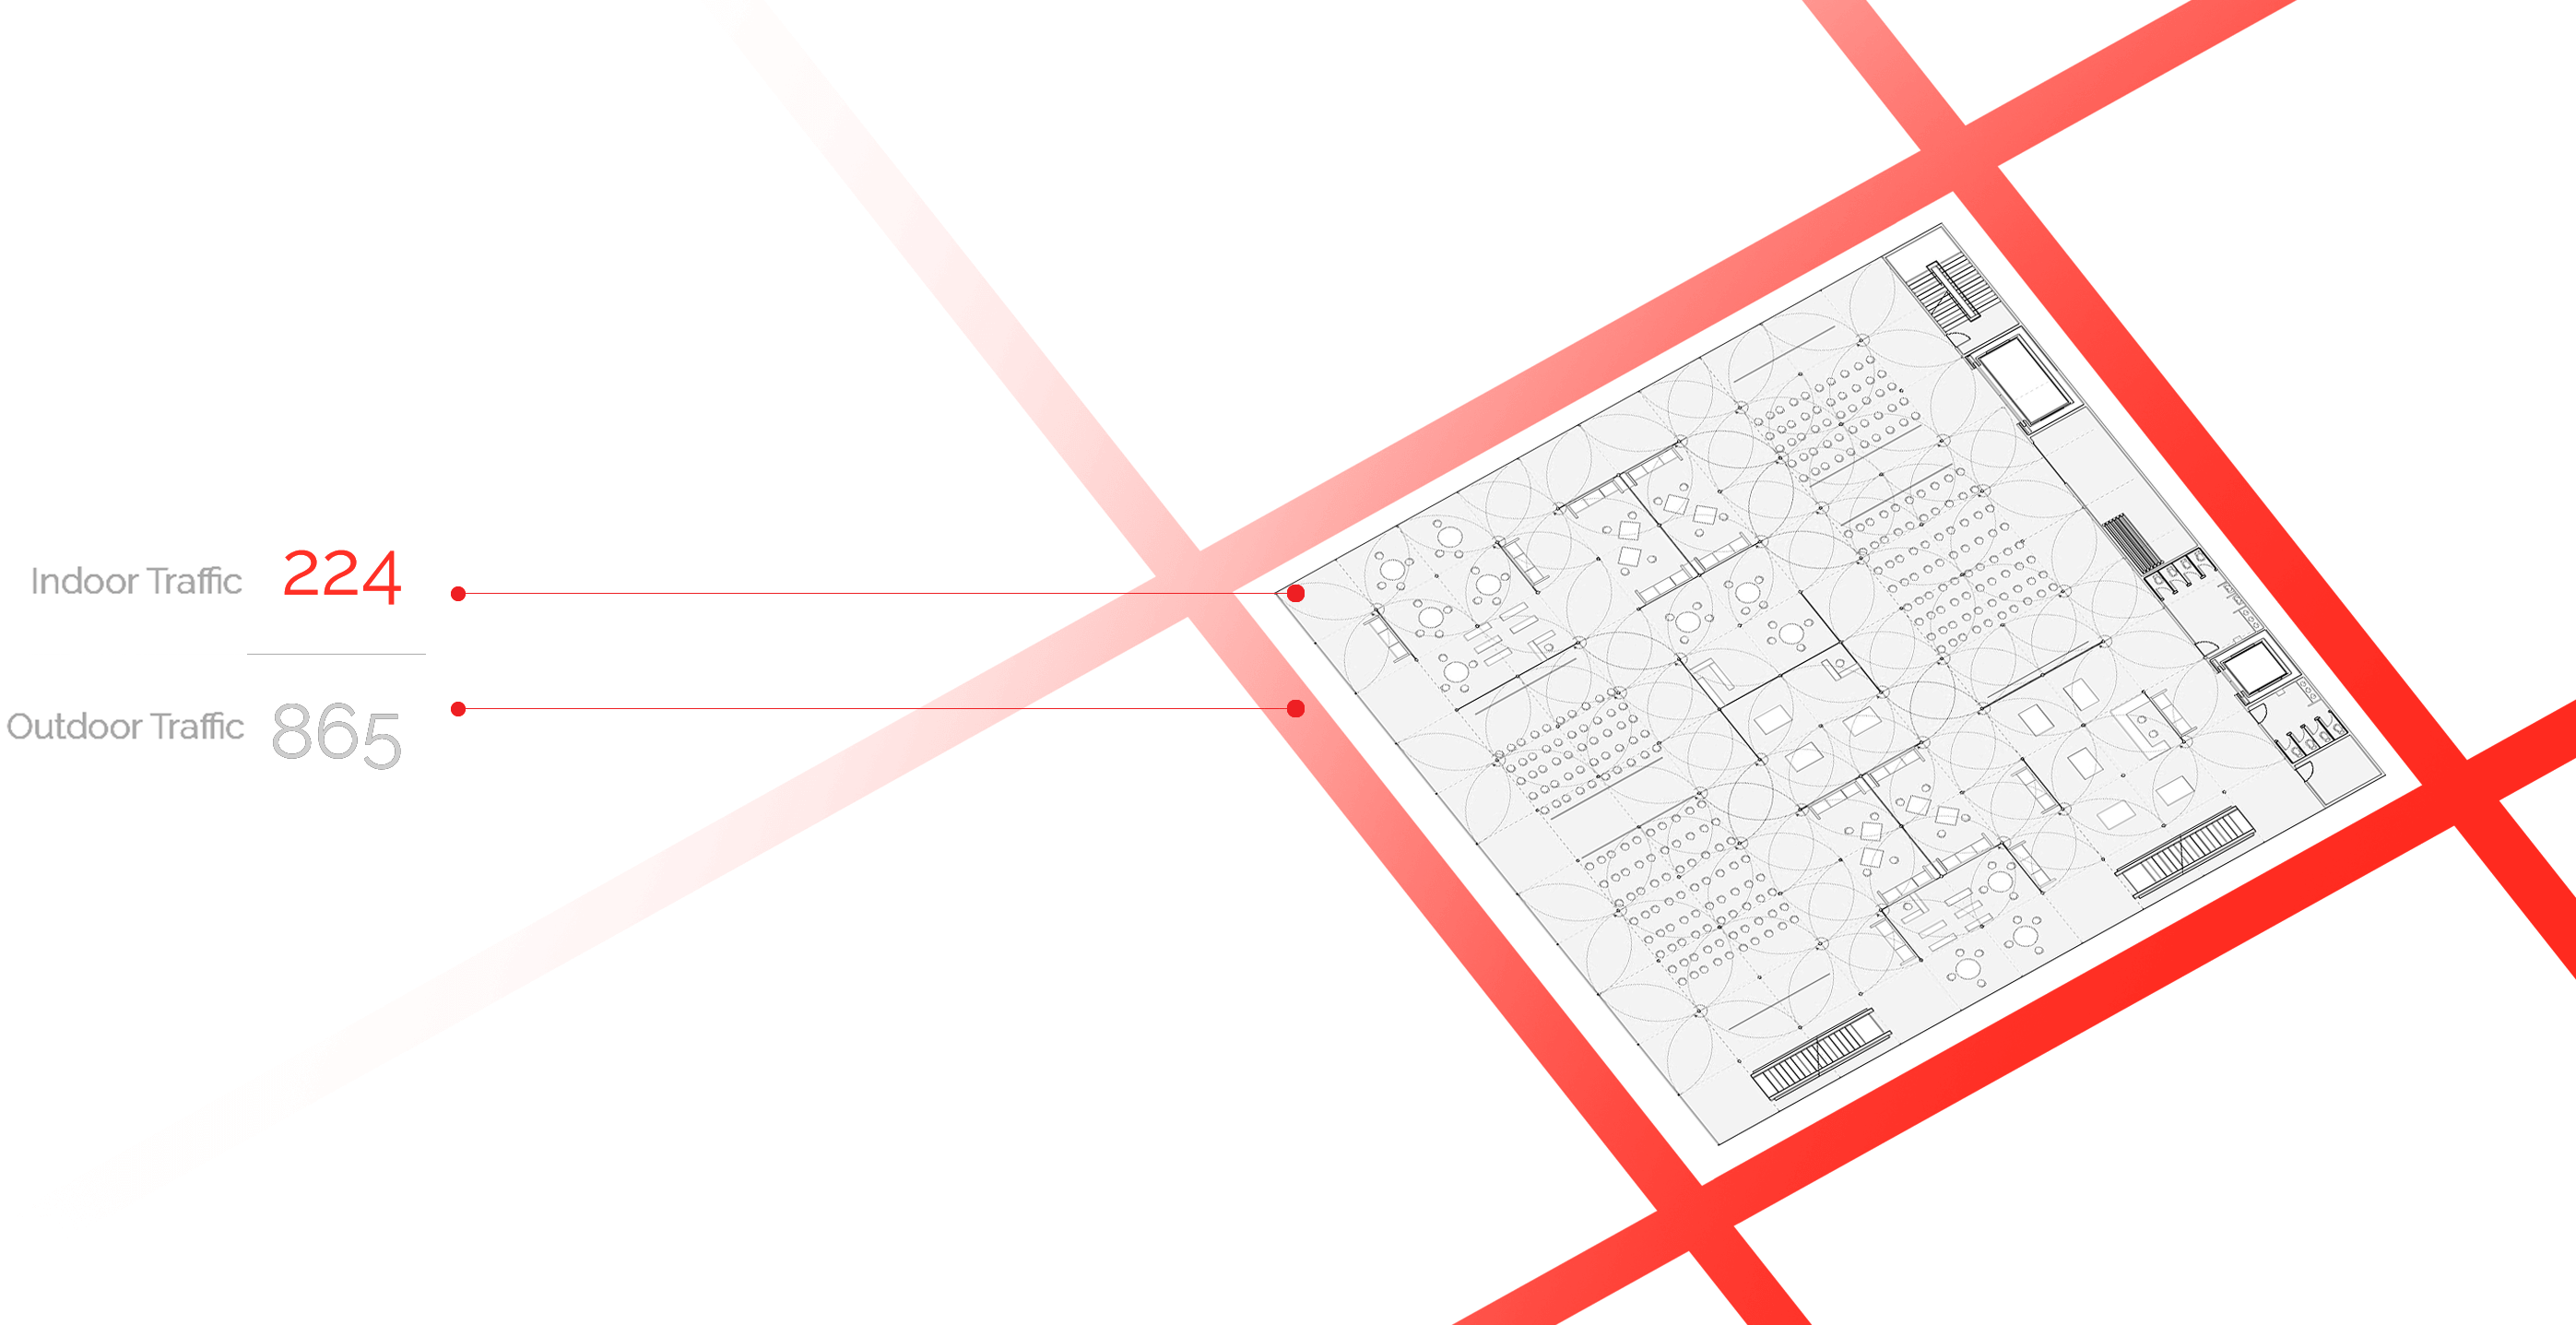
Key to this project is the analytical component. As our building is designed to insure maximal flexibility, qualifying what type of layout sequence the building should undergo is more than crucial. Through the dissemination simple IoT sensors in the store, we can track two complementary metrics about people flows: traffic and dwelling. For the sake of the analysis, the space is “gridded” into squares of 50 cm by 50 cm. This discretization method is in fact common in the industry to track spatial information across a given space. The traffic, then, represents the number of persons passing by a given grid cell over a certain period of time. On the contrary, dwelling represents how many people have stayed in a given grid cell during a given period of time.
Traffic and dwelling are then used to structure and complete four key analysis to ultimately offer a holistic assessment of the building activity:
1/ In-Store Traffic: counts the number a person passing through a store over a given period of time.
2/ Circulation Traffic: the circulation is divided into segments of corridor. Circulation traffic counts the number a person passing through a given segment over a given period of time.
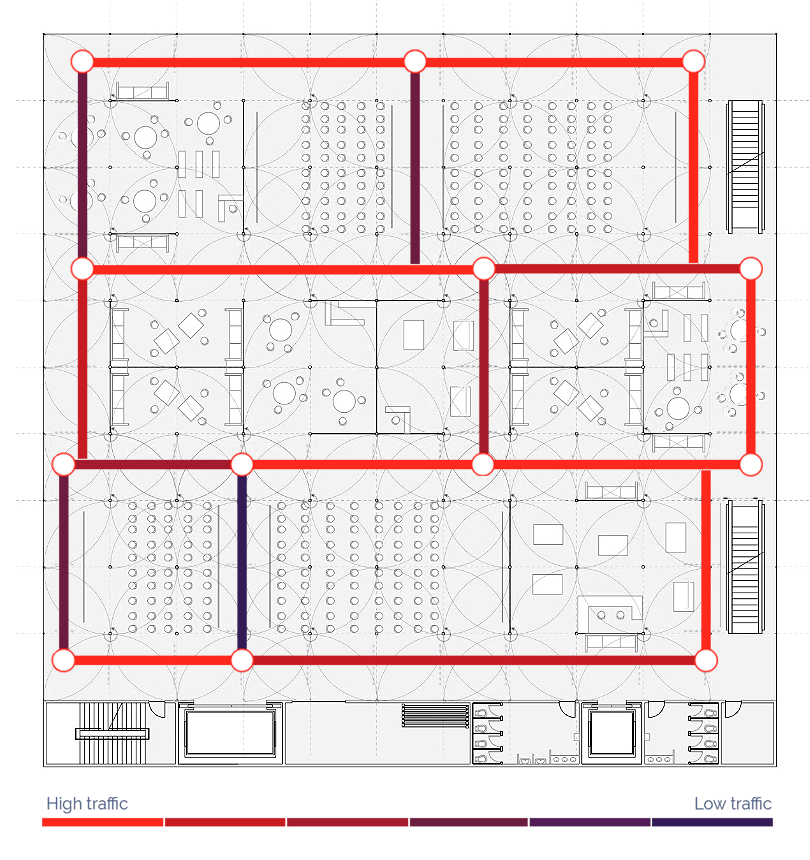

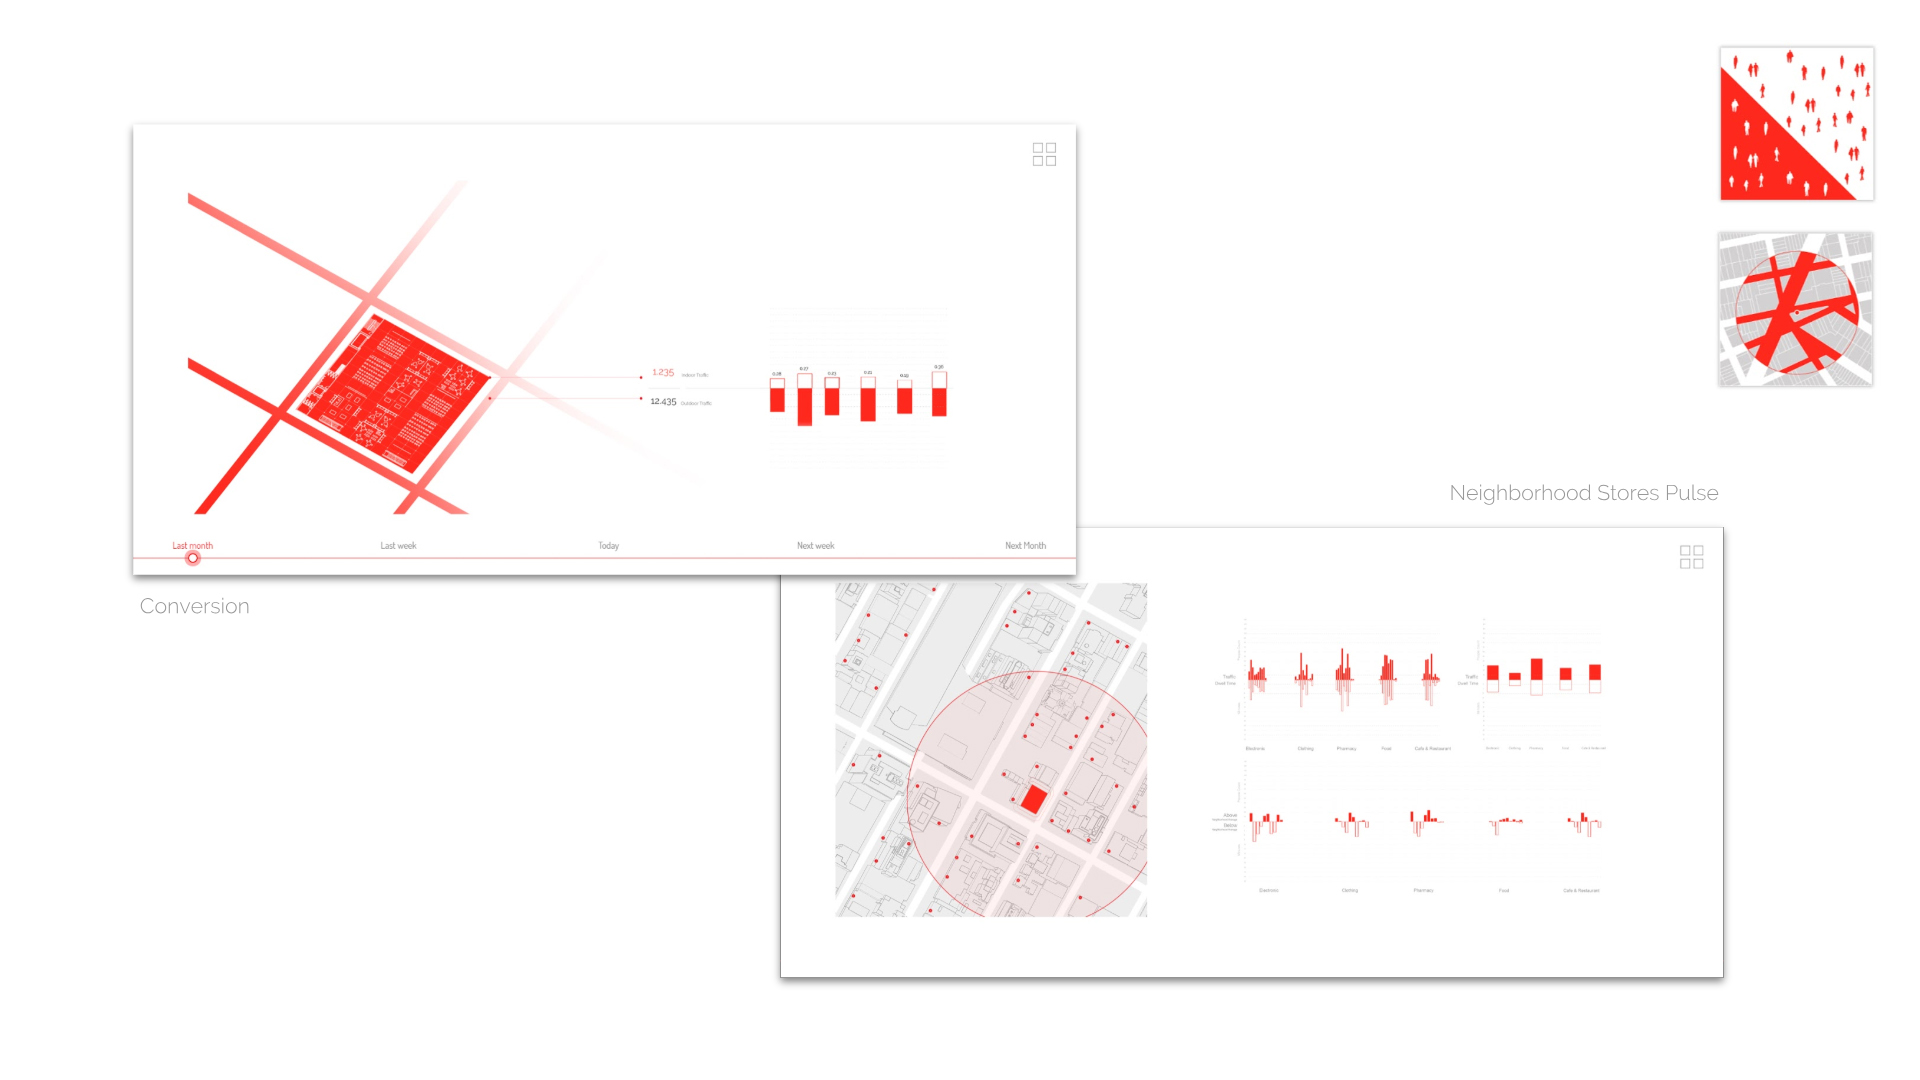
3/ Conversion Rate: comparing in store traffic and the incoming traffic in the corridor, we can deduce a conversion rate, or “how attractive is the store?”, by dividing one by the other. The same approach is applied to the traffic in the street around the mall, and to the total number of people in the mall.
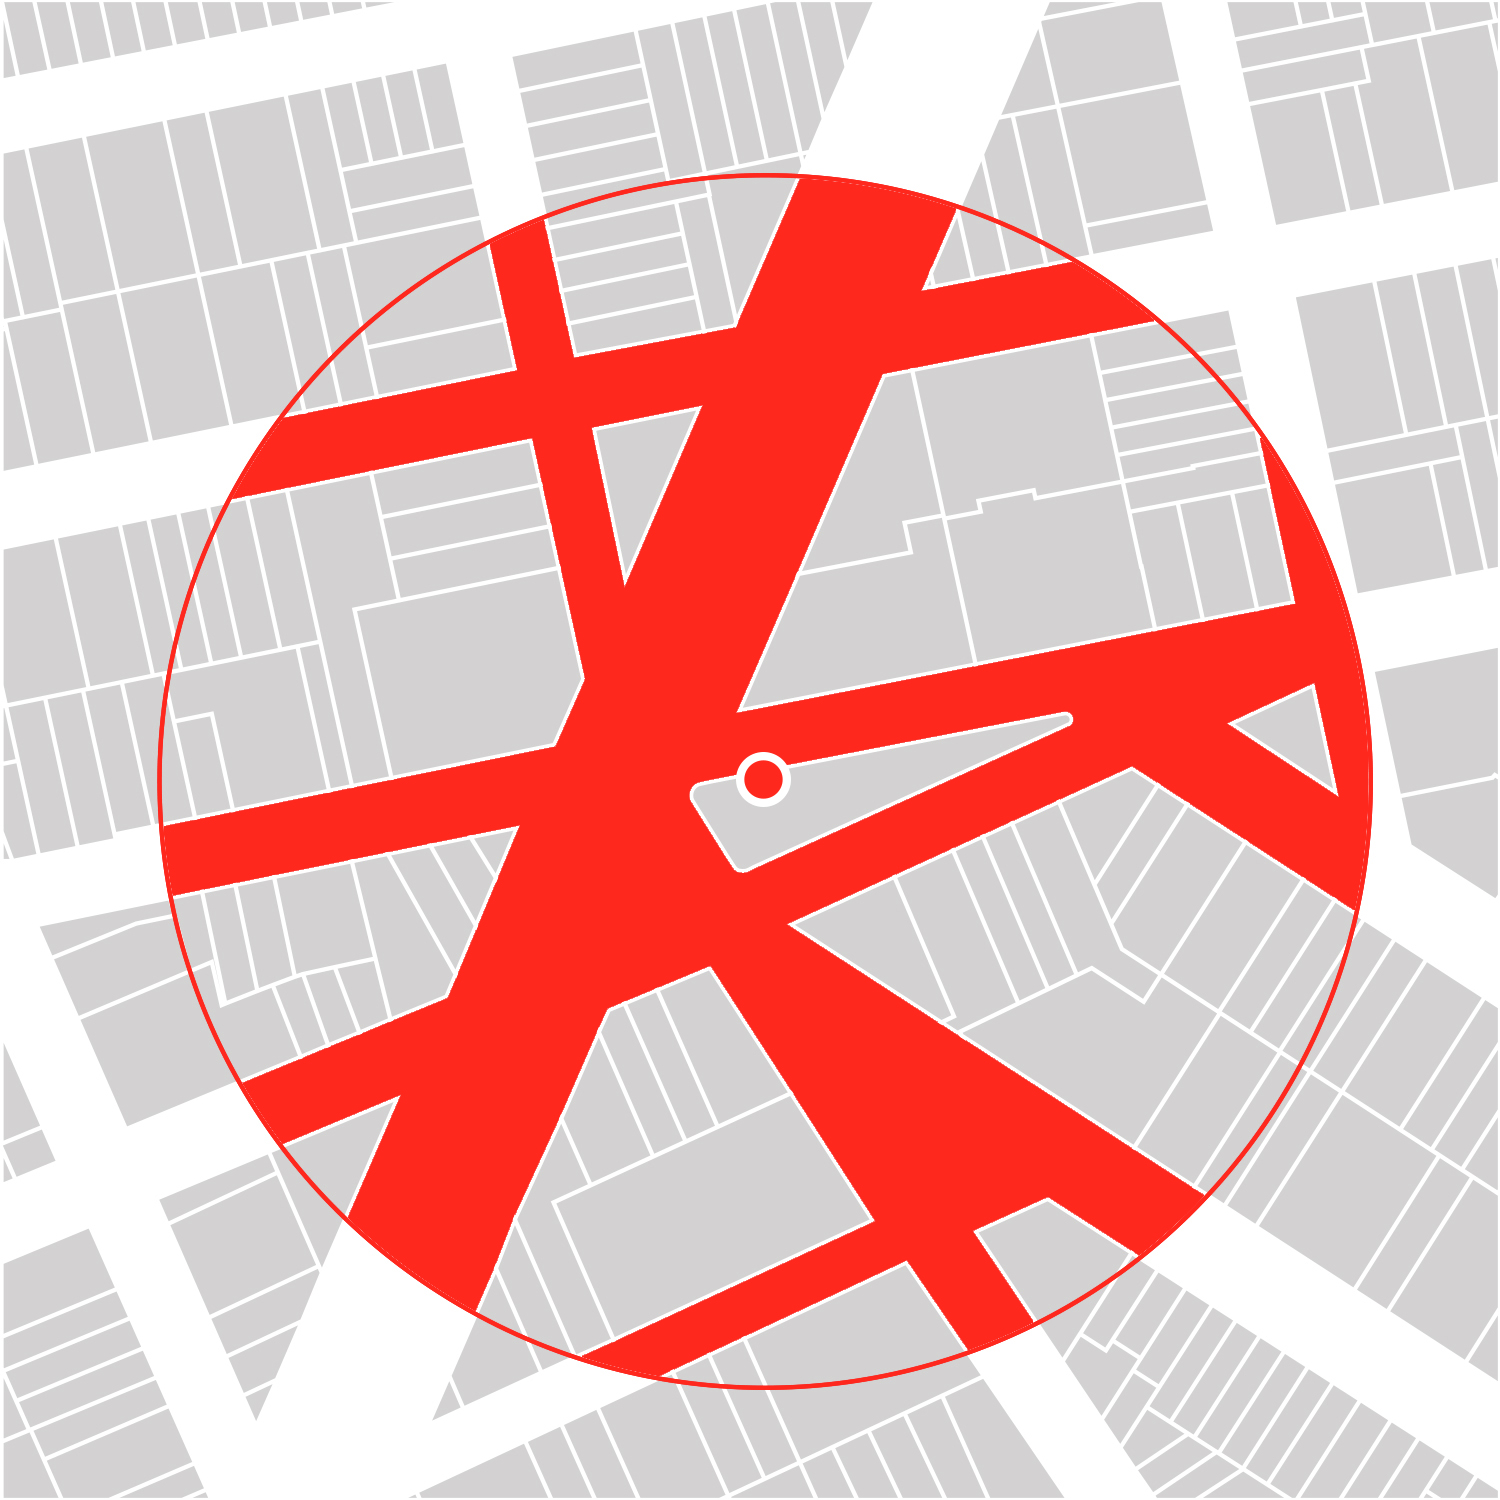
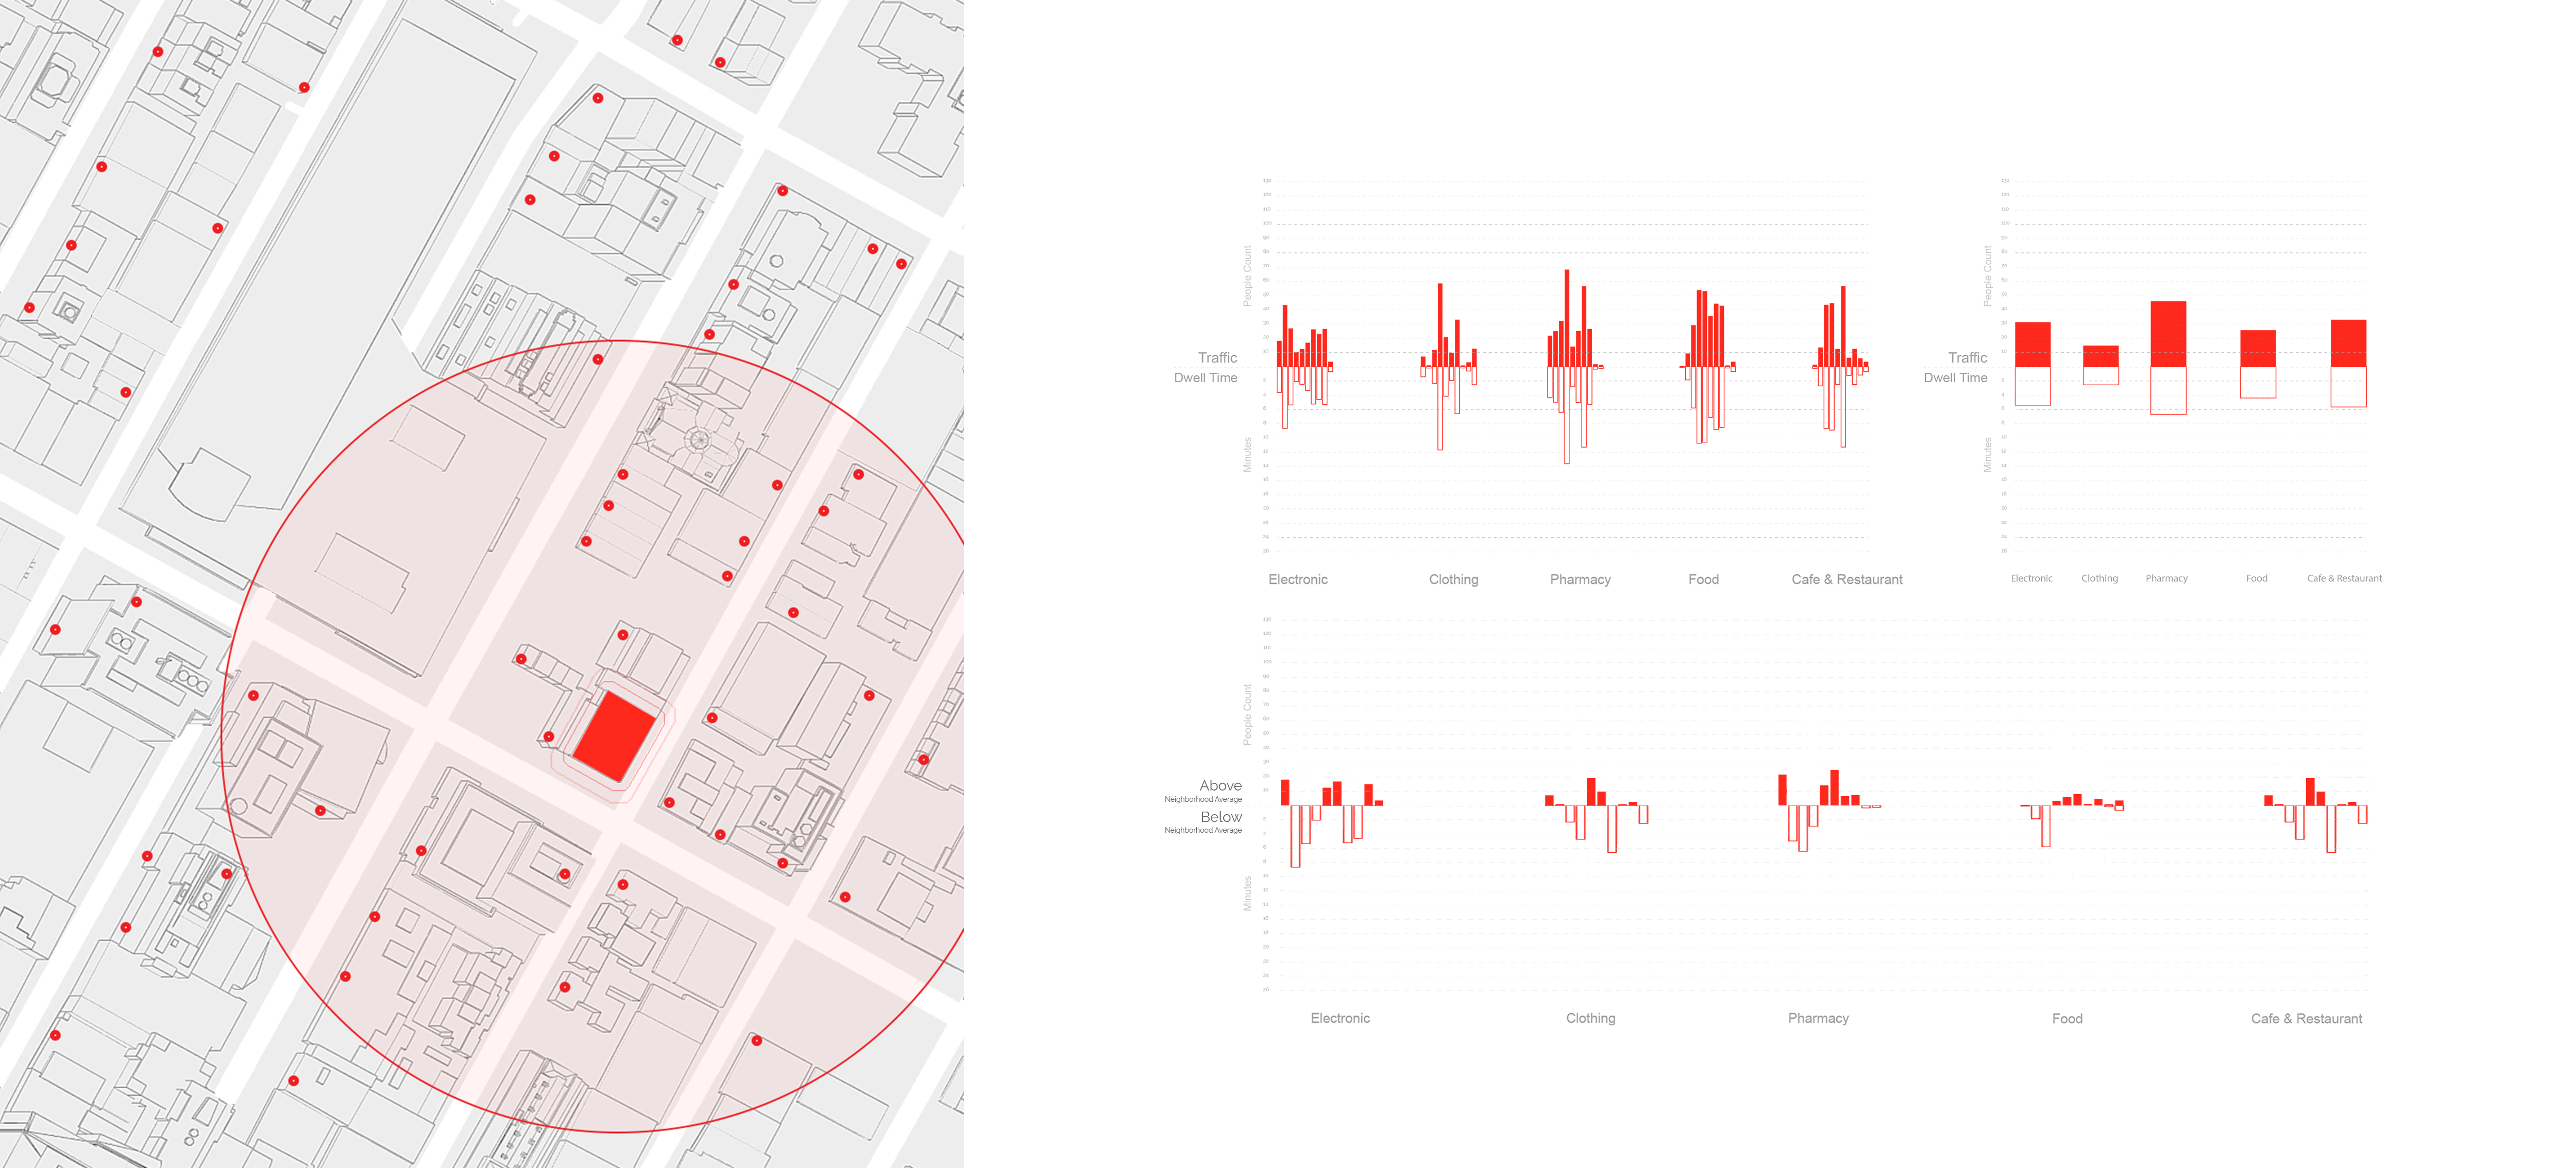
4/ Neighborhood Pulse: finally, to put the indoor traffic and dwelling back into the context of the neighborhood, using Google Places API, traffic information in other stores in the neighborhood is queried and aggregated. This enables apple to apple comparison, by contrasting the performance of the Dynamic mal stores to similar stores in the neighborhood.
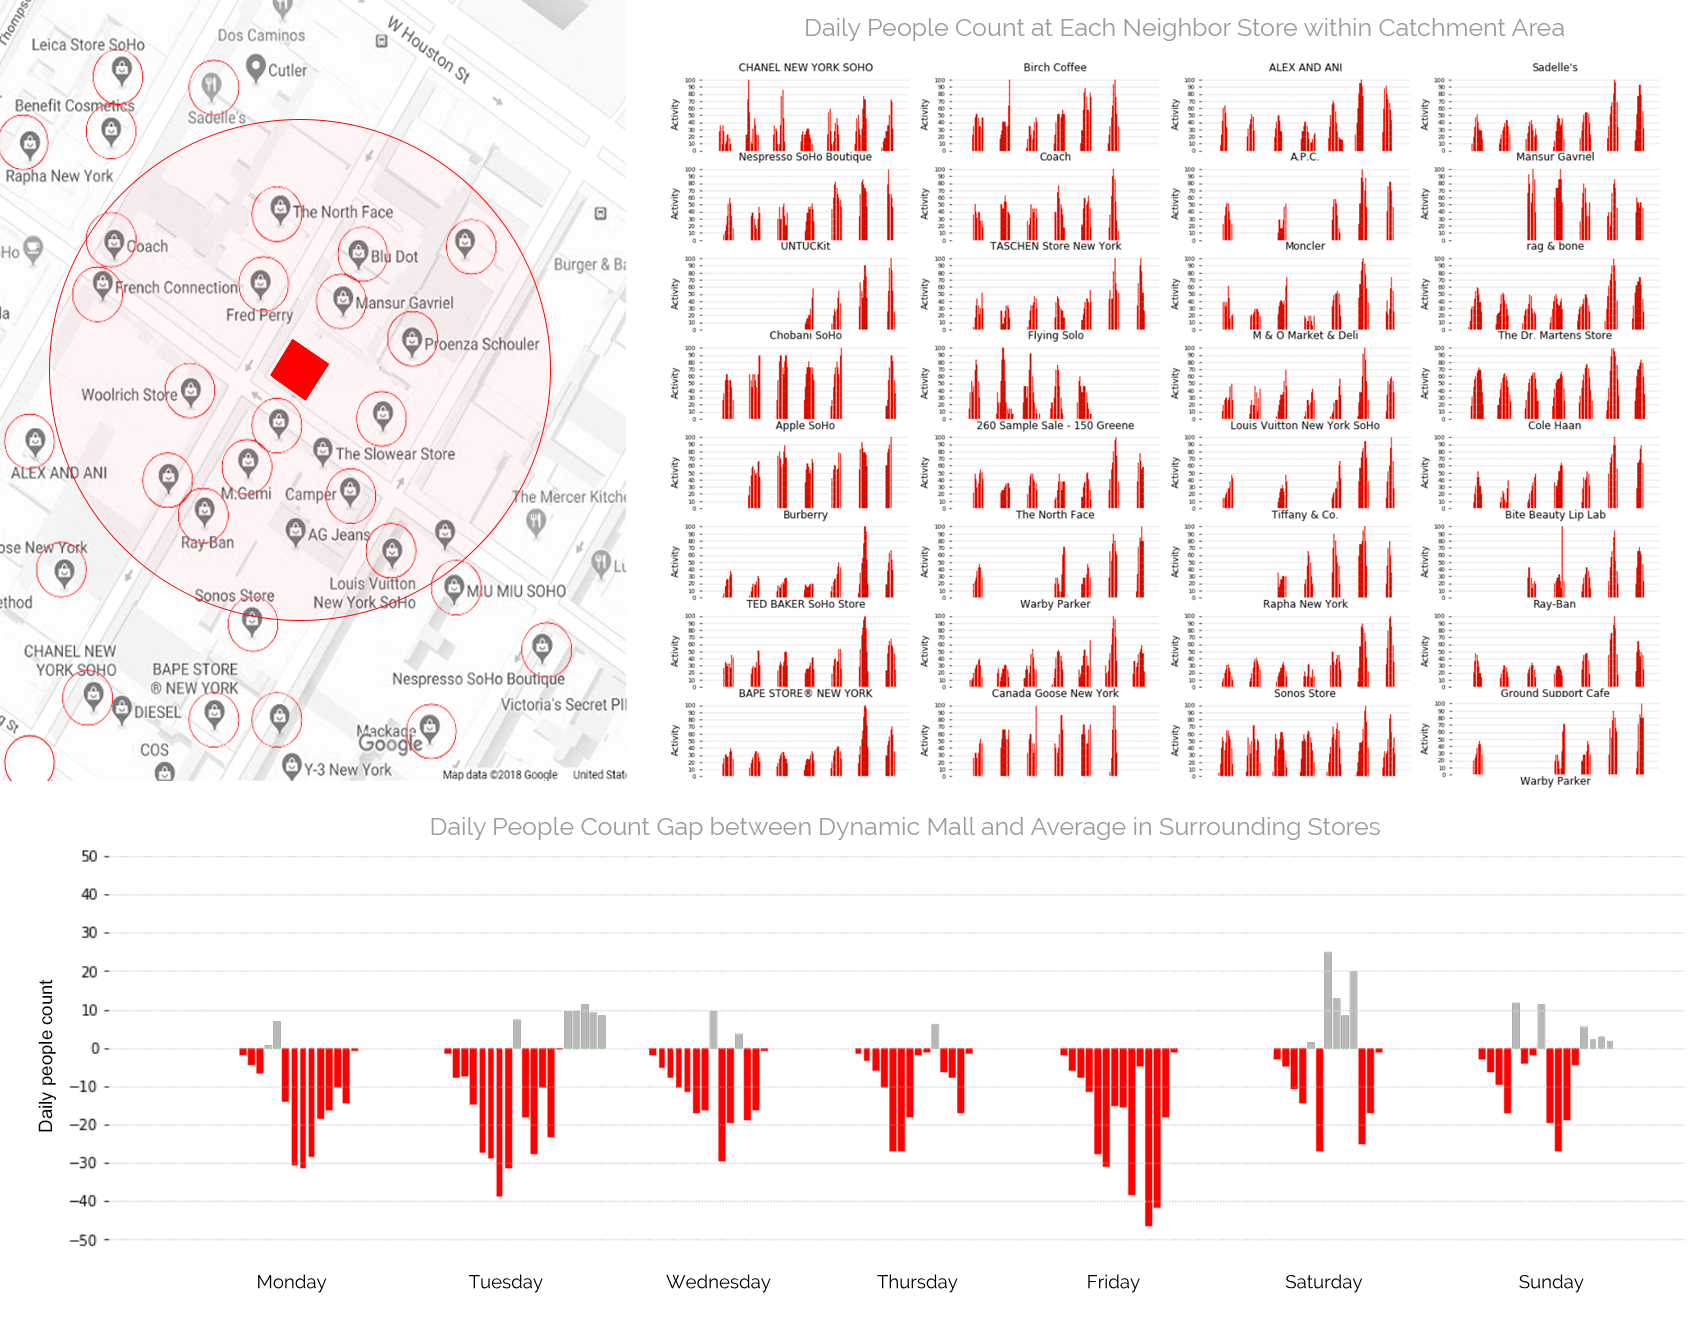
This last metric is the result of a month of development, where we implemented a search feature, based on Google's Popular Times feature, able to return for a given store in a city, the difference in daily and hourly traffic between him its neighbors, within a defined catchment area. The methodology and its code (python notebook) can be found on Github.

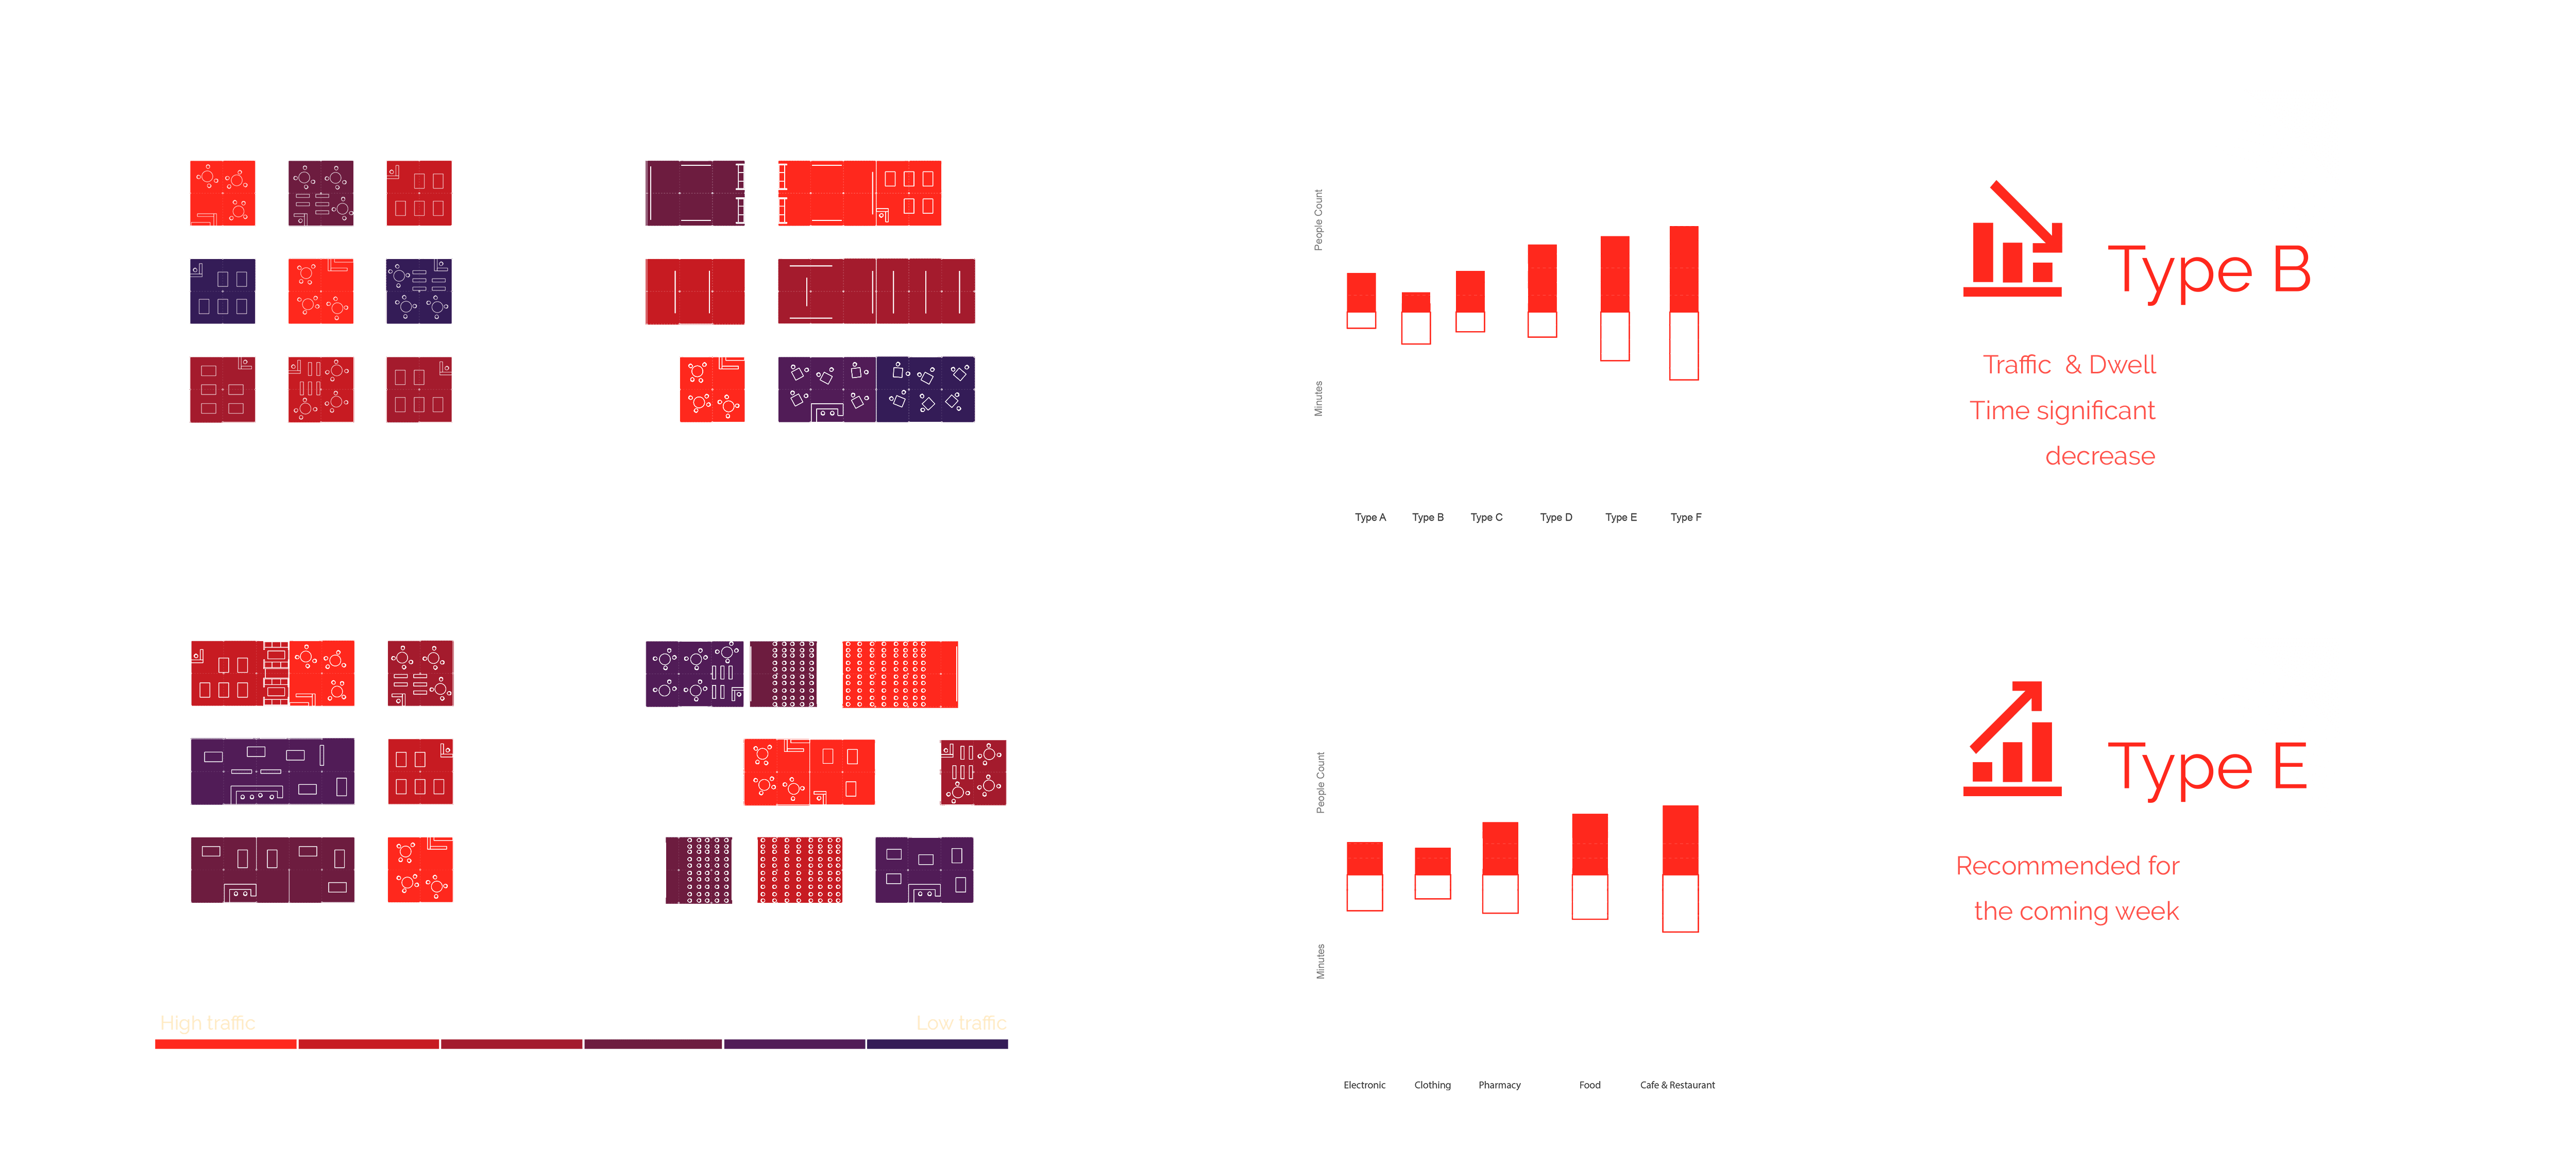
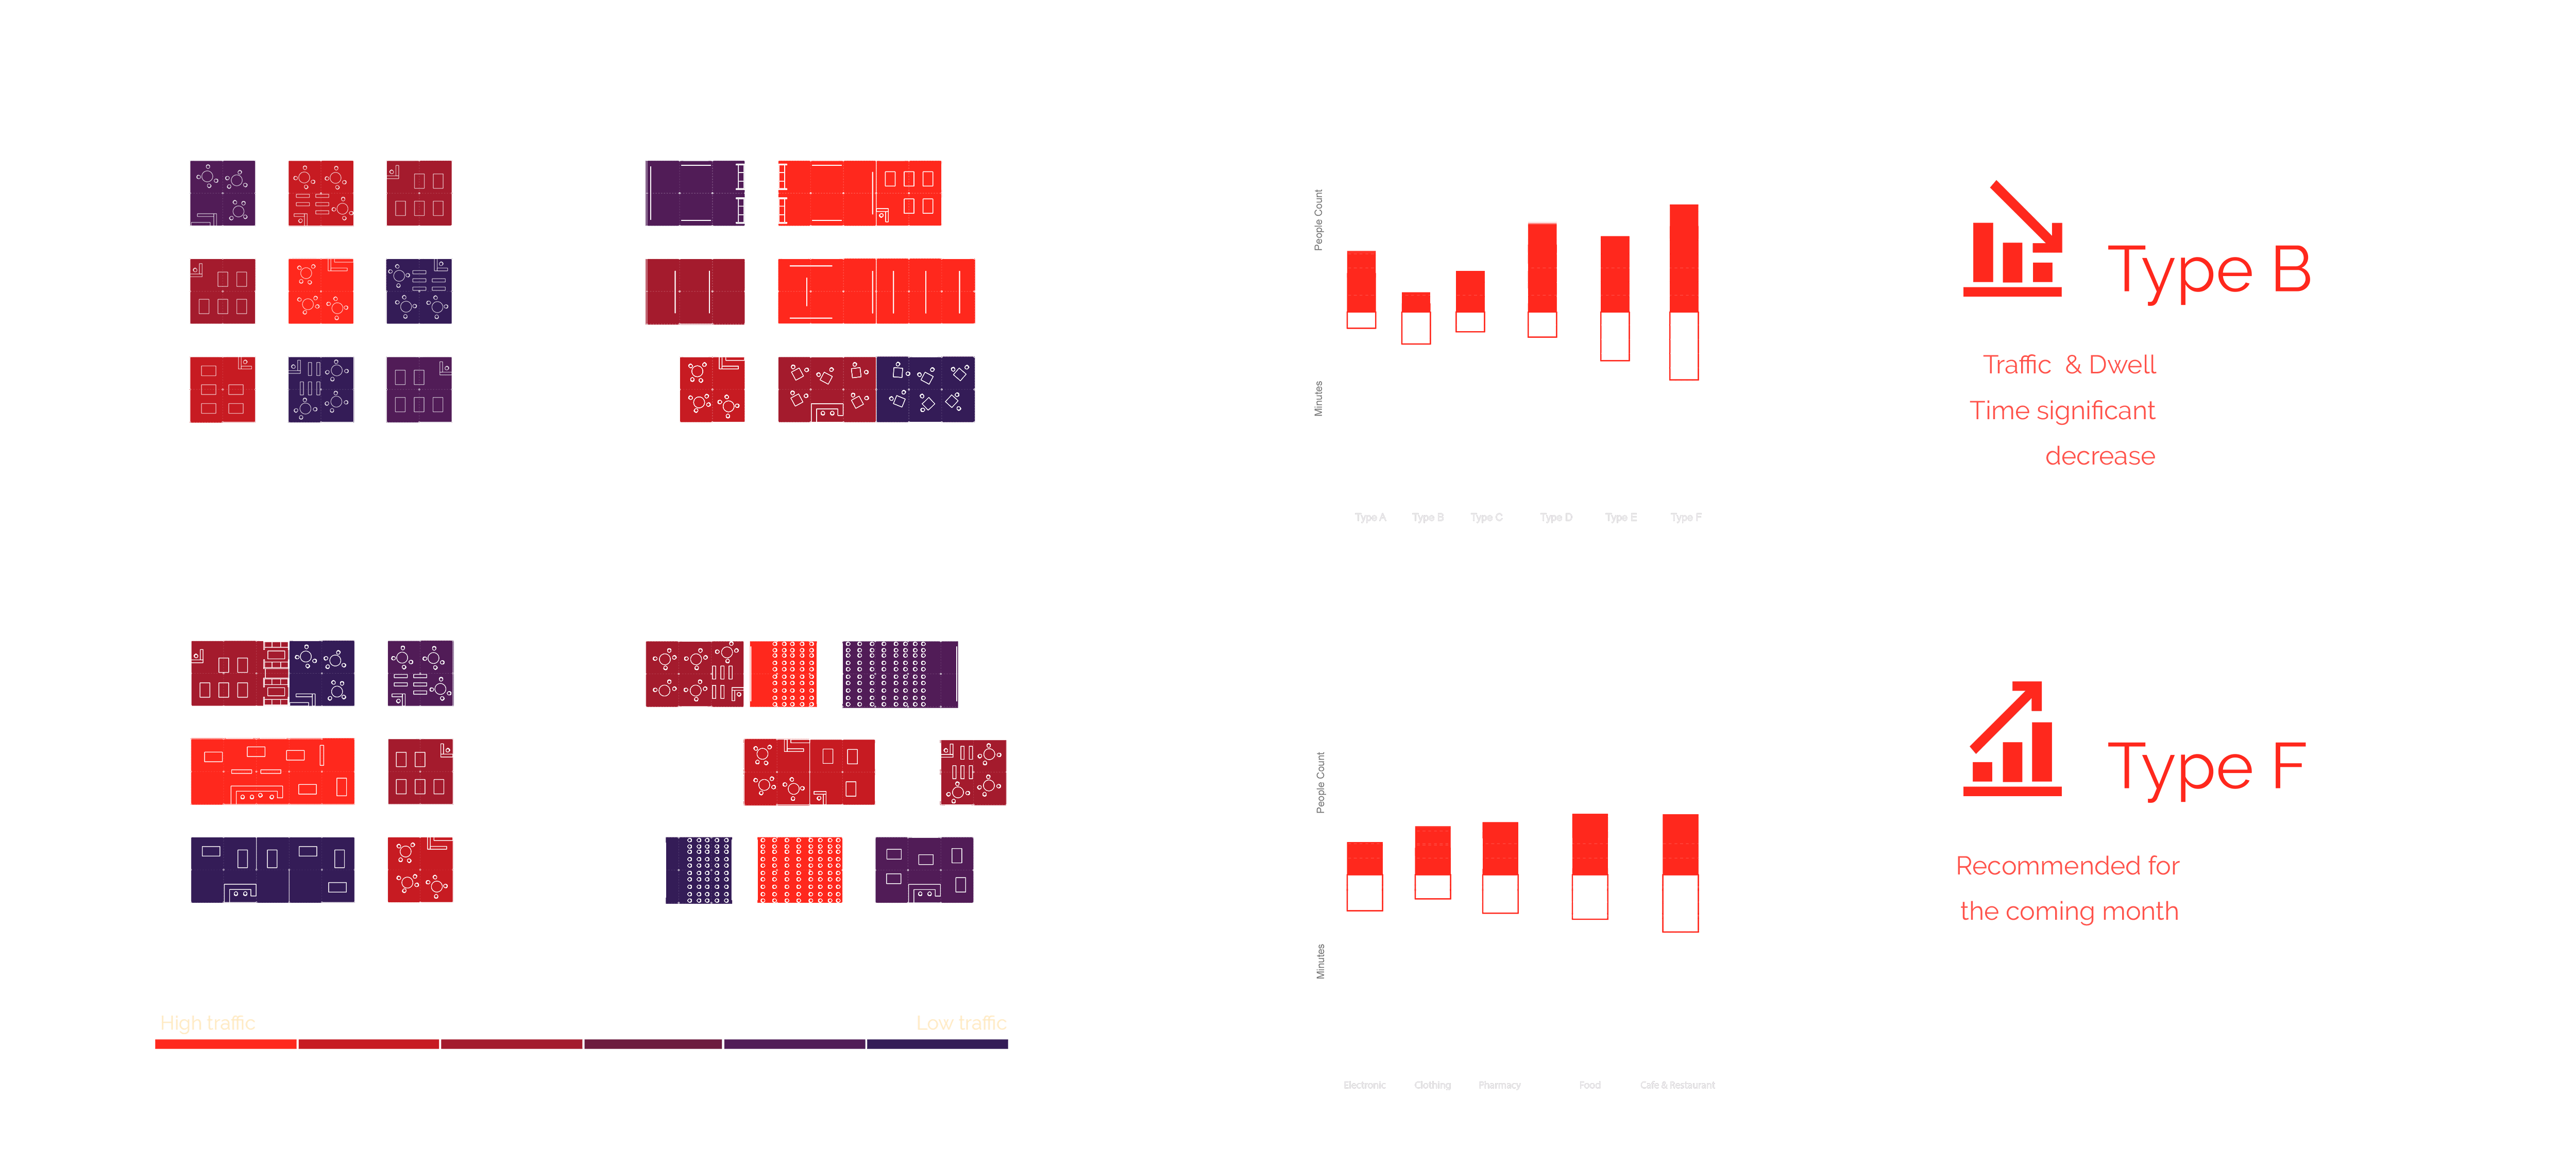
Dashboard & Prediction
All these metrics are finally reported into a dashboard, at the top of this page. Each analysis is available for five distinct period of time: last month, last week, today, next week, next month. While the three first ones give a summary of past performances, the two last ones build on top of the past experience, to predict the future indoor activity of the mall. Under “next week” and “next month” advises are even provided as to how the layout could be set in the following weeks/months.
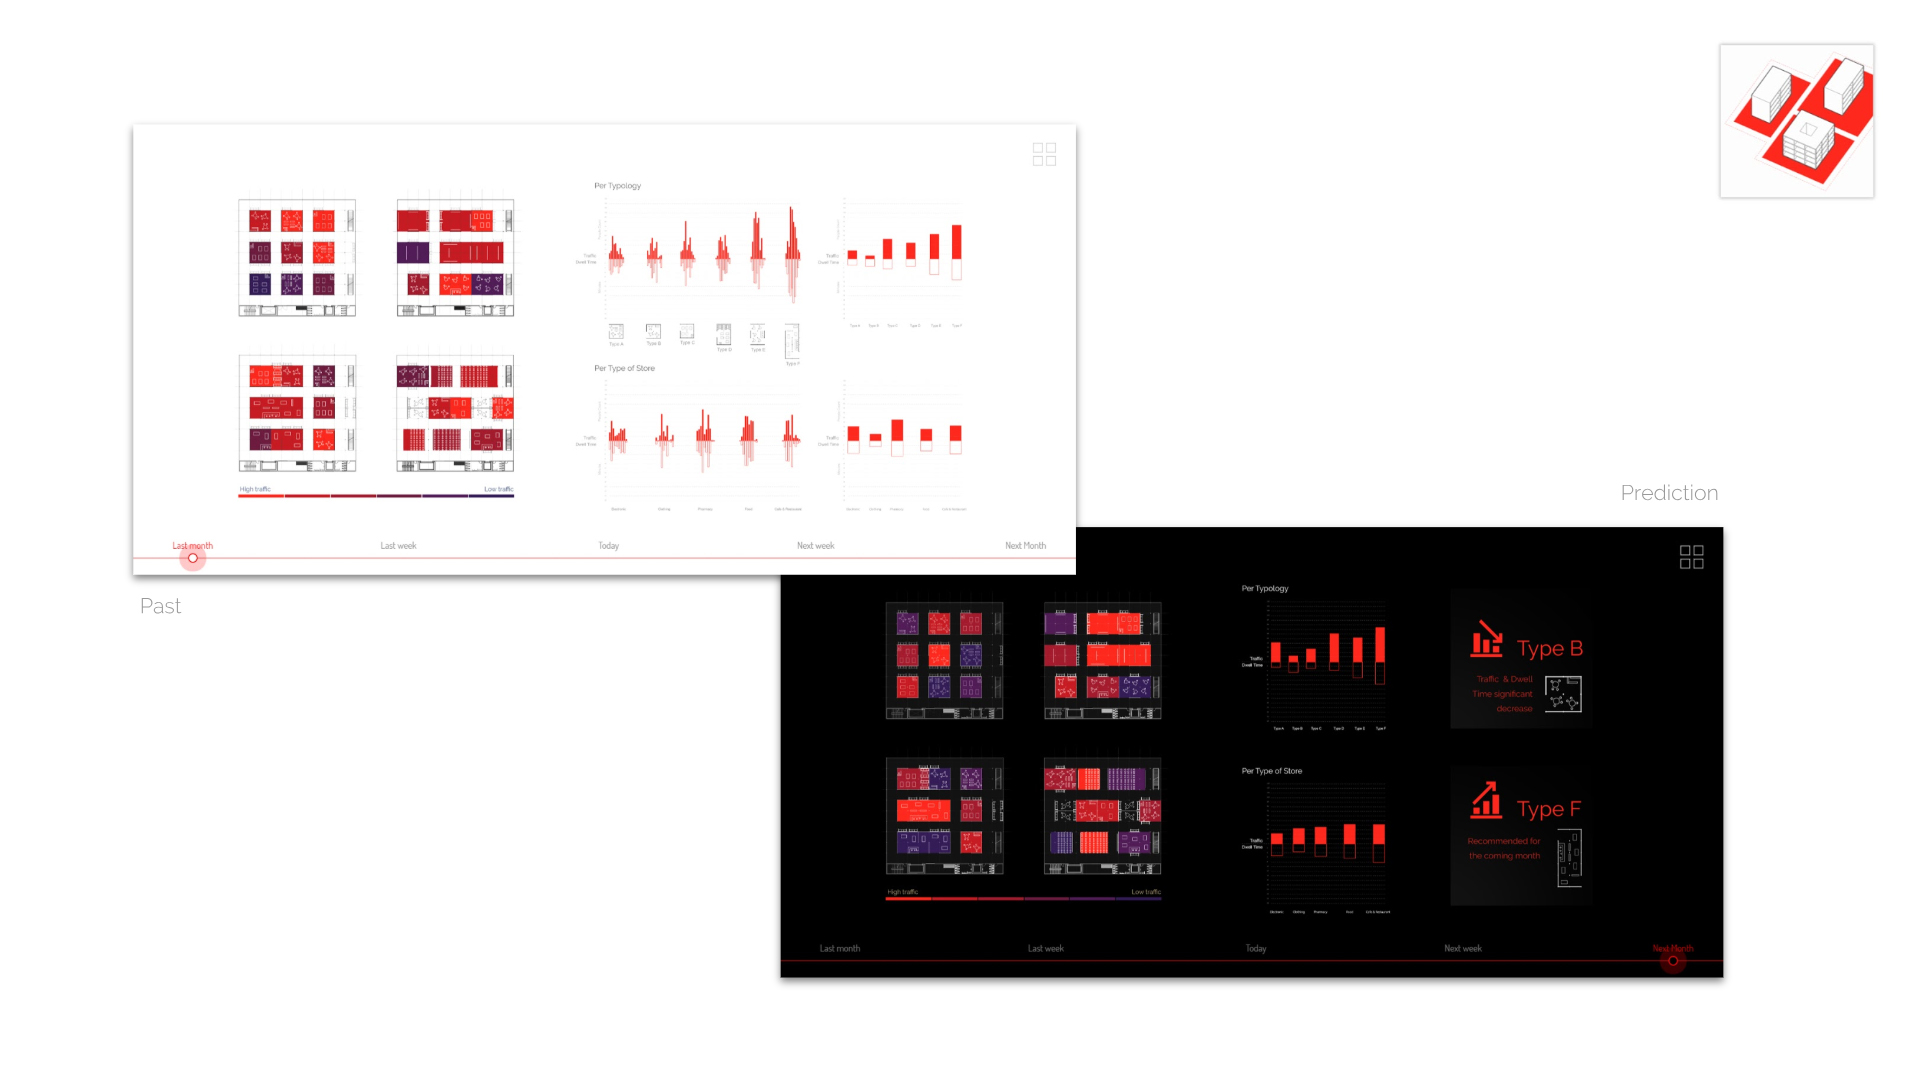
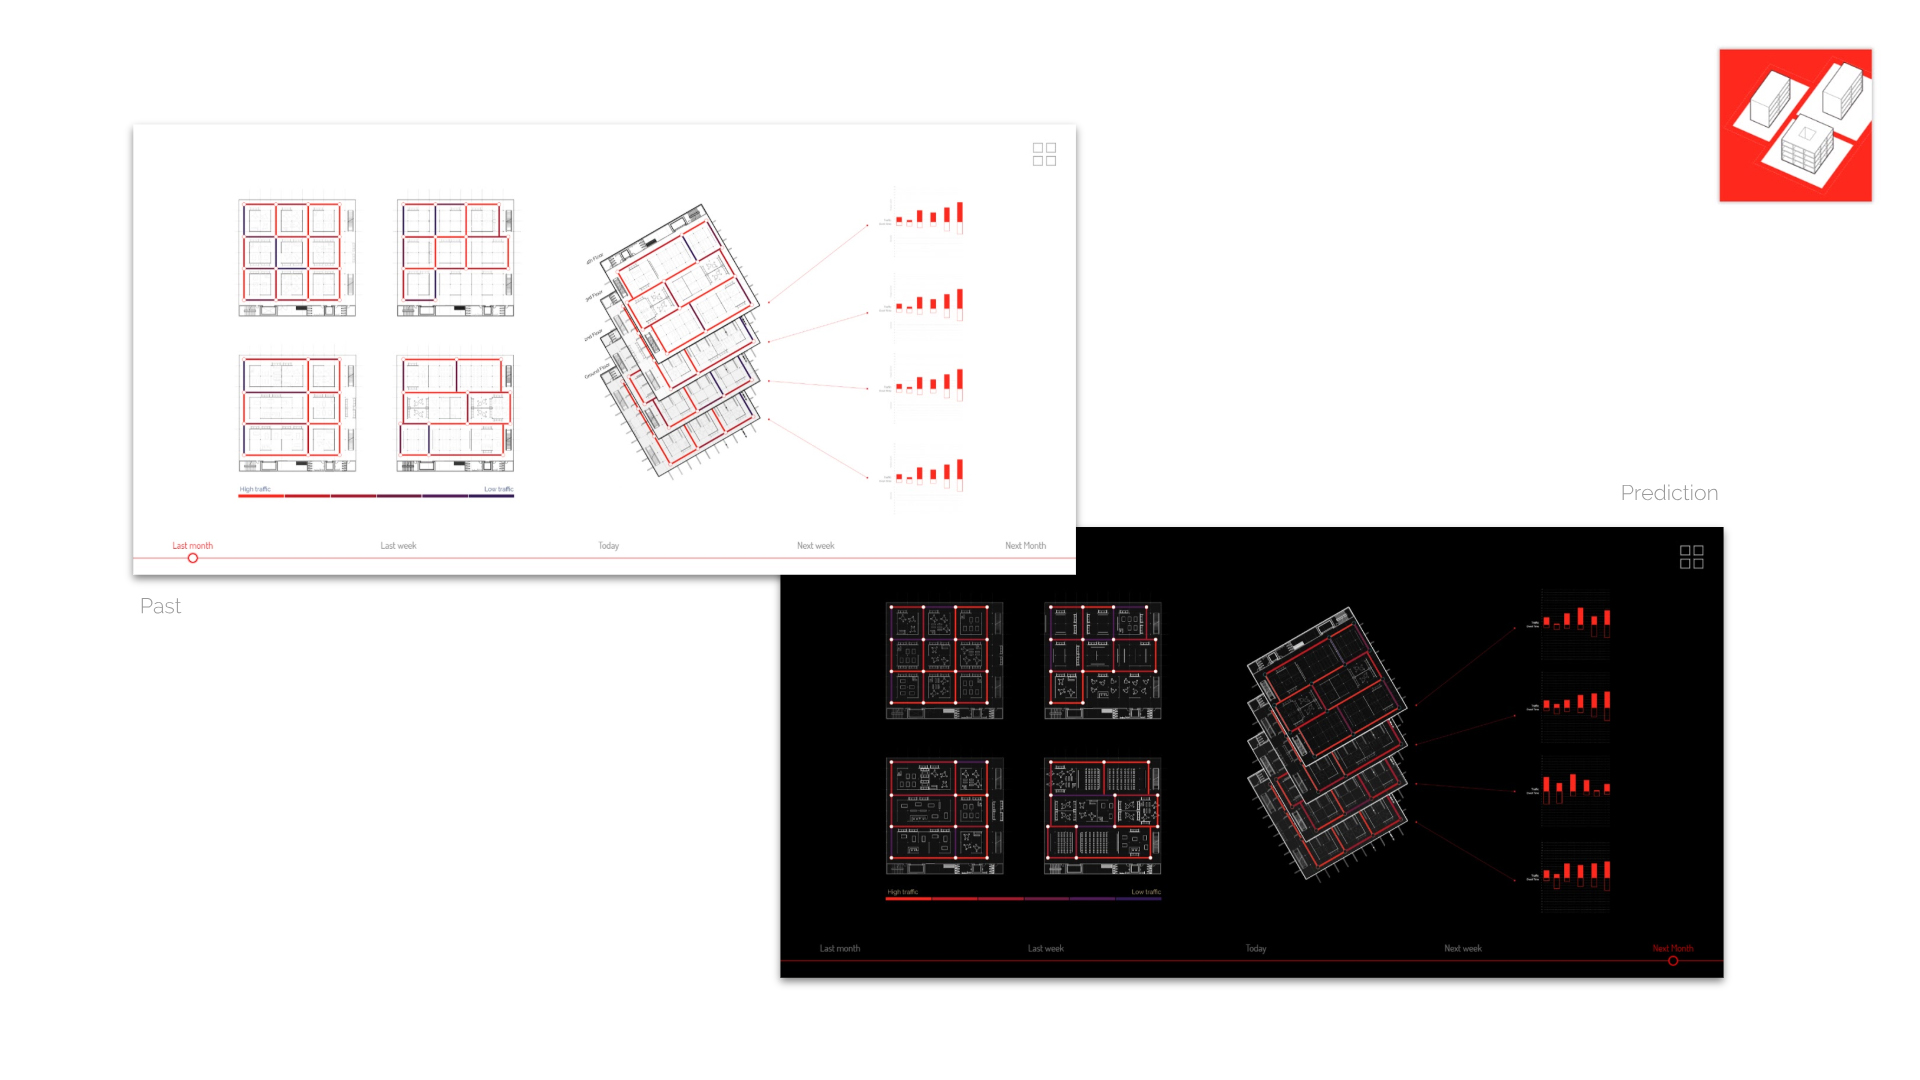
This last element is essential: not only is our dashboard a source of information, it also represents a layout assistant for the owner, the tenants and potentially the architect. It is the enabler of the building daily “choreography”.
Conclusion
The Dynamic Mall simply exemplifies the advent of flexibility in our built environment. Adaptation and elasticity of space could answer both the challenge of urban densification and space usage cycles, already happening today.
A new time-based urban realm, able to react to predicted usages and flows offers a fascinating new perspective for our cities, and challenges the core of the architectural profession: should the architect deliver a building as a finished product? Or can she/he be the choreographer of the building daily layout evolution?
