


GeoScanner
Geospatial Query Simplified
With the advent of geospatial databases, urban planning can benefit from a large variety of information to inform designs.
However, the accessibility of such data, as well as handling it remains a challenging process. The GeoScanner brings simplicity and ease of use to planners, by allowing them to simply query information, within a set search radius, while staying in a framework commonly used in the profession: Grasshopper. The GeoScanner component can ingest tabular data as well as standard shapefiles and outputs a collection of graphs, to qualify and quantify the information at stake.
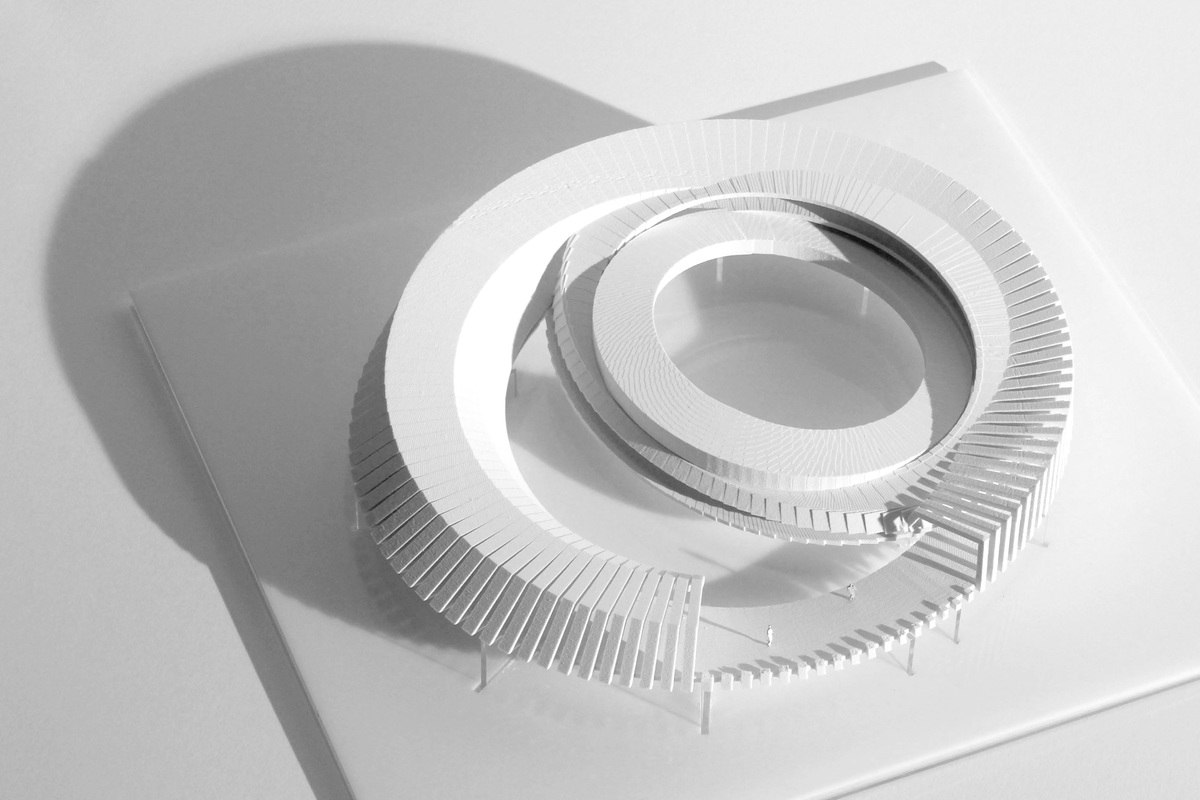
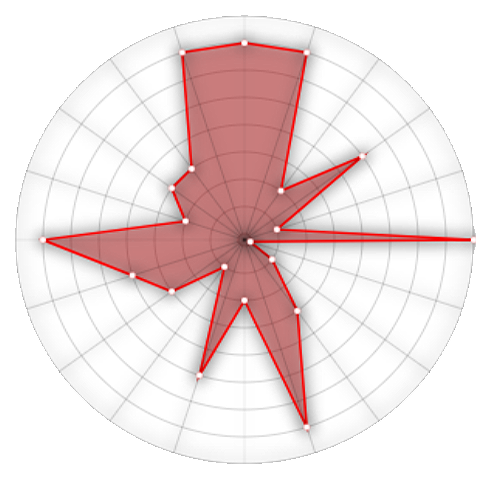
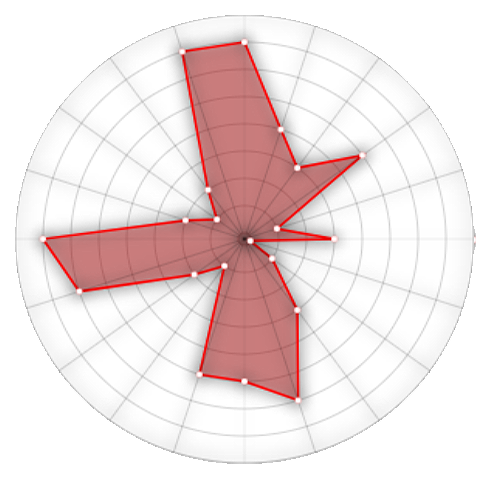
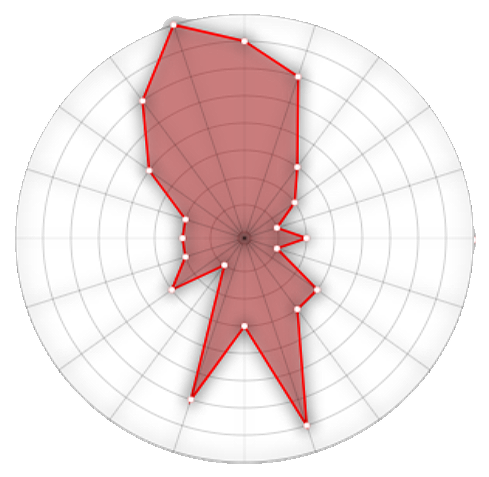
Typical Quadrant, output of the GeoScanner
See the use cases here below: Use Case 1, Use Case 2.
Use Case 1
NYC Traffic
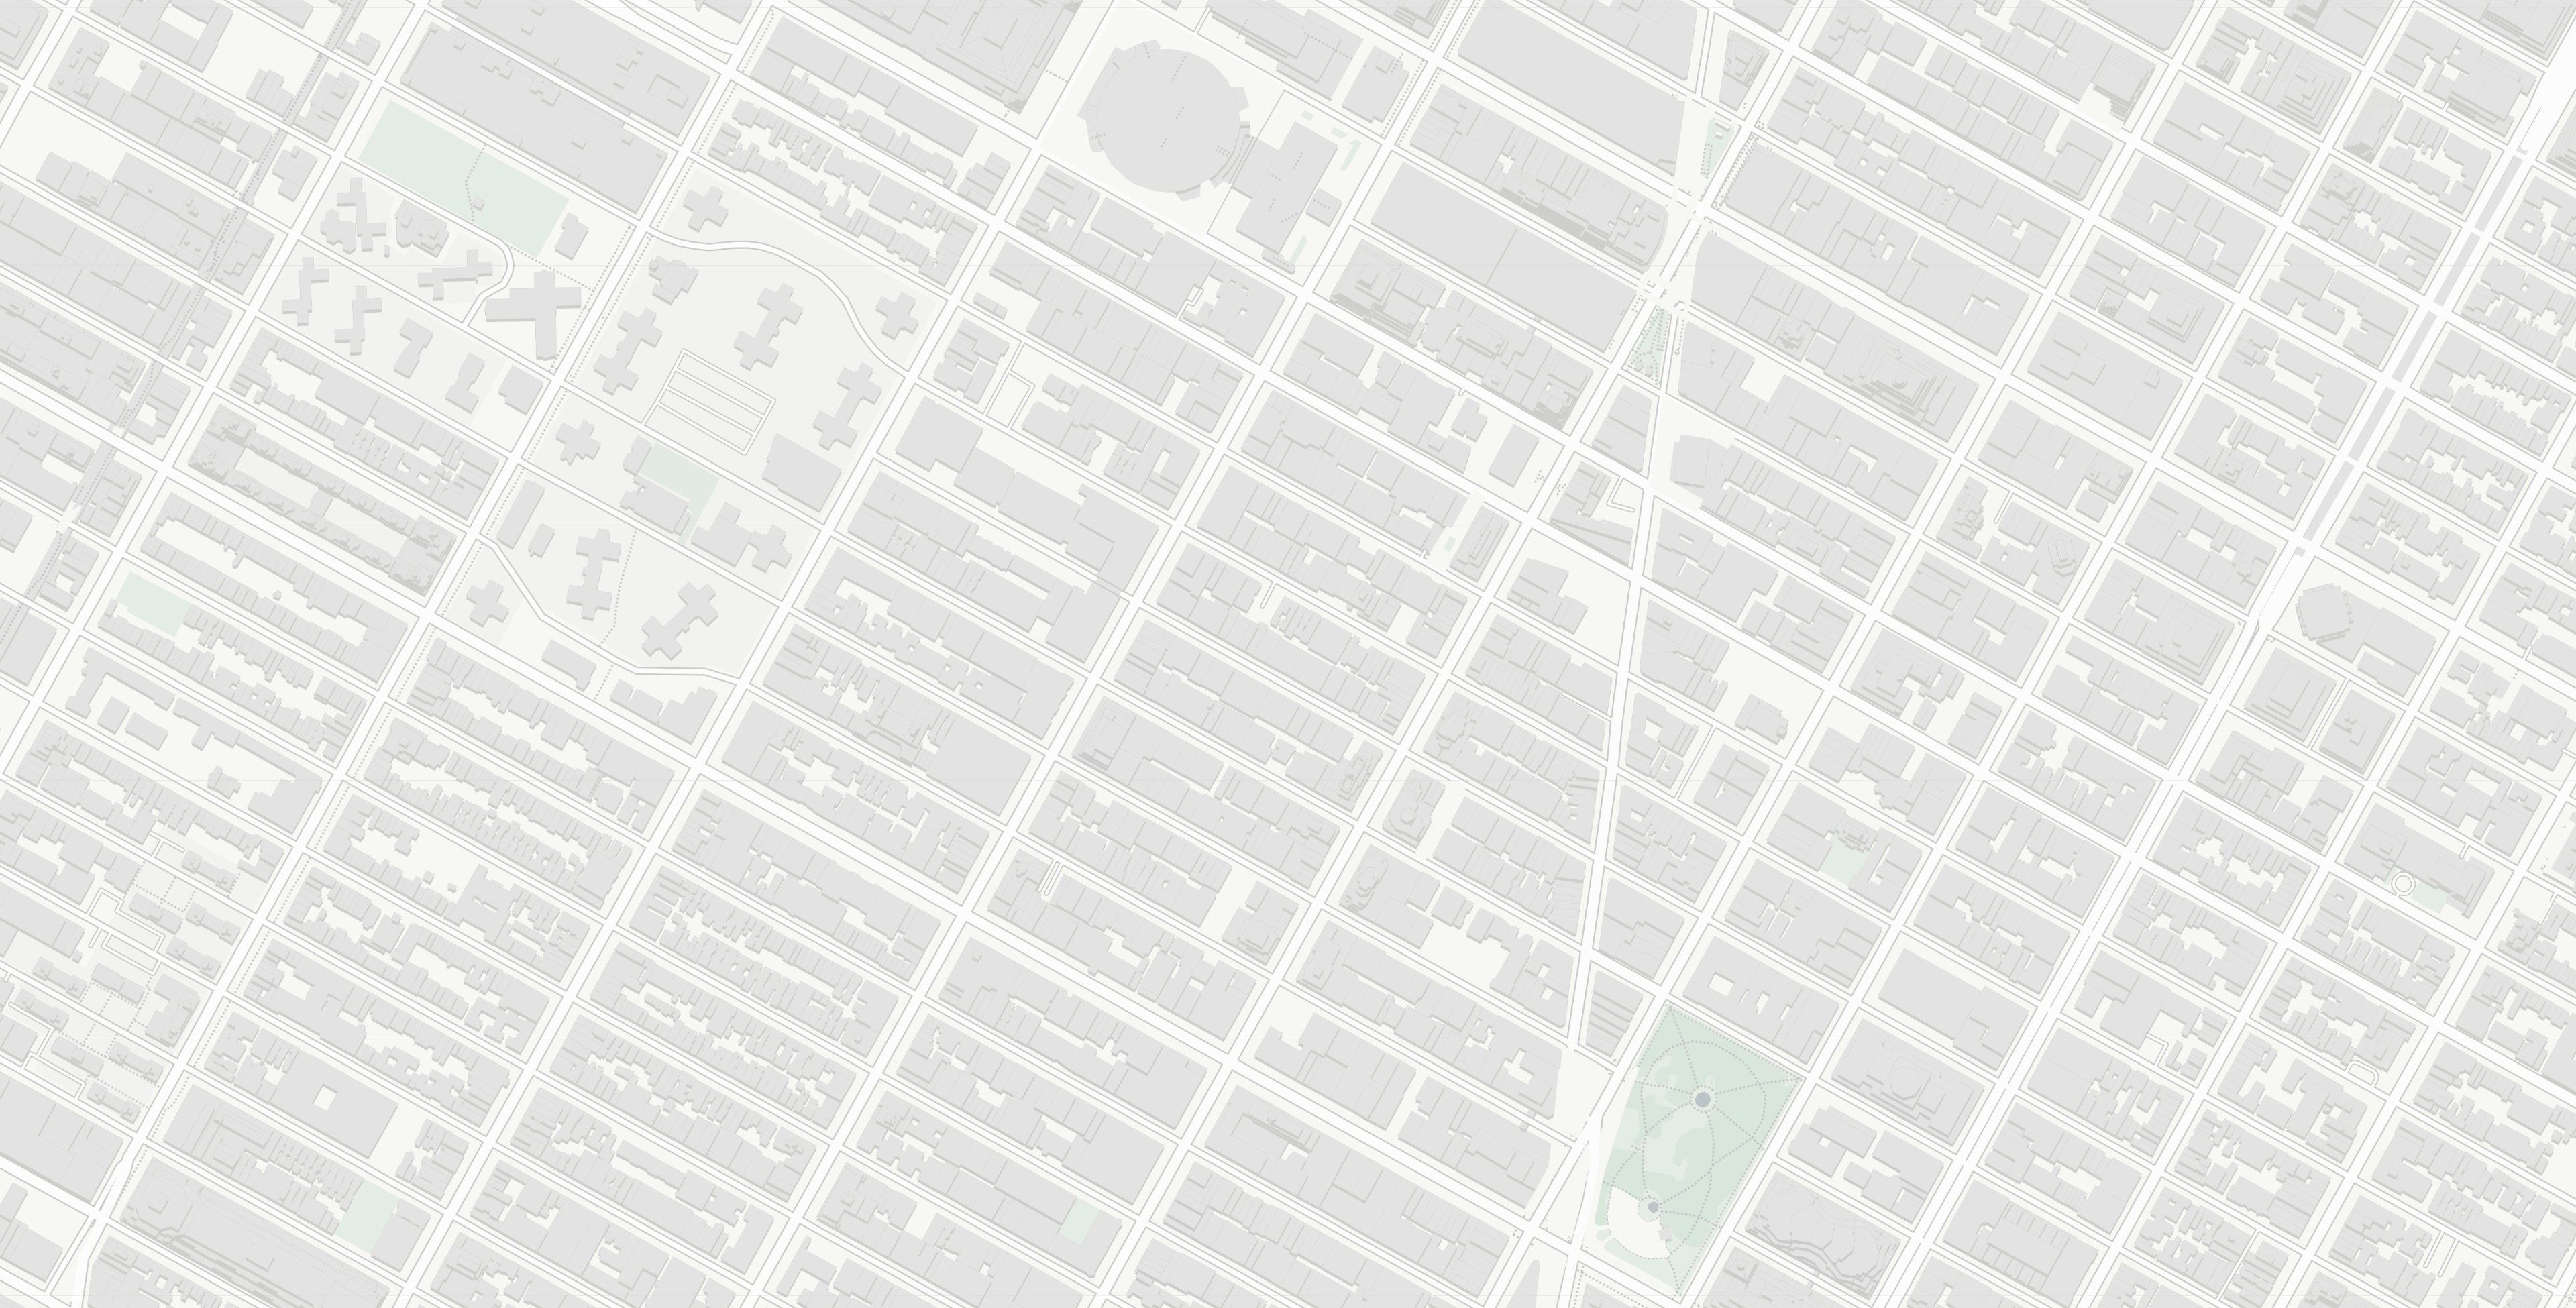
A first application of the GeoScanner happened in 2017. In the context of a paper published then, we offered to use our tool to analyze traffic density in Manhattan.
Using data collected on the NYCOpenData platform, we could pool together an extensive amount of traffic data: City Bikes, cabs, Uber rides, Bus rides, and metro traffic. The tool offered the possibility to see for a given place in the city, and for a catchment area of either 100 or 250 meters, the density of traffic, aggregated either monthly or daily. In addition to the traffic intensity at the given place, the graphs would also provide a city average at the same time. This enabled us to qualify the intensity of the traffic relative to its context. Ultimately our methodology provided a clear assessment of the traffic activity surrounding any given building in Manhattan, at any time of the day for the past 4 years.
The GeoScanner is applied here to Manhattan. On the right, the user changes the position of the target point. On the left, the GeoScanner outputs the daily traffic per bike stations, and the number of drop-offs per station in the catchment area.
Use Case 2
ZhengZhou Metro System


In 2018, in the context of a studio at the Harvard Graduate School of Design led by Professor Busquests and in association with Tianhua, one of the largest Chinese architecture office, the GeoScanner was redeveloped to provide to our sponsor a rigorous analysis of ZhengZhou’s metro station surroundings.
The city, planning to build above 250 metro stations over the next 25 years, will profoundly change its morphology soon. With the GeoScanner we offered to generate a catchment area analysis for each planned station, looking at surrounding land-uses. The analysis proved conclusive, bringing insight to Tianhua, and informing their long term development strategy in Zhengzhou.
The GeoScanner is applied here to Zhengzhou. On the left, the user selects a given metro line. On the right, the GeoScanner outputs a quadrant of surrounding land uses within the catchment area for each metro station of the selected line.
Other Projects